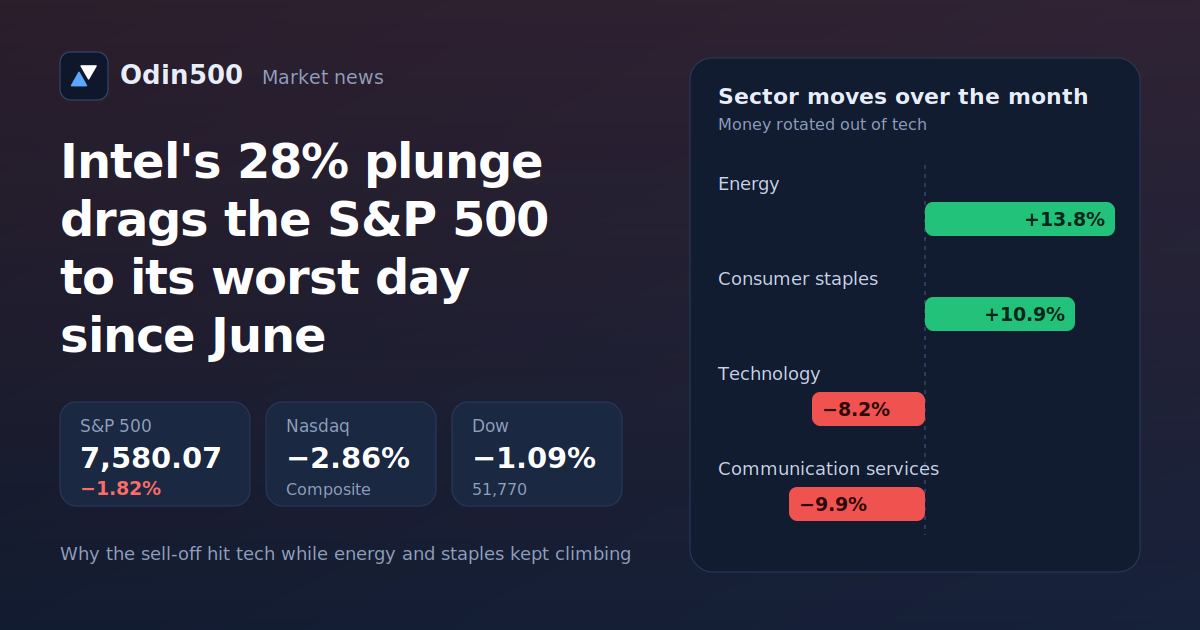
Wall Street had its roughest session in months. The S&P 500 slid 1.82% to 7,580.07, its biggest one-day drop since early June. The Nasdaq Composite fell 2.86%, the Dow lost 1.09% to close near 51,770, and even small caps got hit, with the Russell 2000 down 1.66%.
The trigger was Intel. But the more interesting question is why one chipmaker's bad forecast was enough to shake the entire market. The answer says a lot about where investors' heads are right now, and about what might come next.
Intel's worst day in decades
Intel closed down 28.58% at $65.76, its steepest one-day fall since 1974. At one point during the session it was off as much as 30%.
What makes the move so striking is how it started. Intel came into the report after a huge run, up roughly 150% for the year. A stock that has more than doubled is priced for good news, and good news is not what it got.
The company guided fourth-quarter revenue to between $15 billion and $16 billion, while analysts had been looking for about $17 billion. Its adjusted earnings forecast of 25 cents a share was well below the roughly 43 cents the Street expected. Management also warned that the slowdown in the PC market should last at least through the first half of next year.
A strong quarter that didn't matter
Here's the part that surprised a lot of people. The quarter Intel actually reported was good. Revenue rose 21% to $16.5 billion, and adjusted earnings came in at 52 cents a share, more than double the 23 cents from a year earlier. Its Data Center and AI division grew 78% to $7.3 billion.
So why the collapse? Because markets trade on what comes next, not on what just happened. And the next quarter looked weak for a specific reason that almost sounds like a paradox: the AI boom is helping one half of Intel's business while squeezing the other.
AI servers still need plenty of traditional processors to manage data and run software around the AI chips, which is why the data center unit is booming. But those same AI servers soak up huge amounts of memory, and memory makers have been selling to AI customers first. That has made memory for ordinary PCs scarcer and more expensive, which weighs on PC demand. Intel's client computing business, its larger unit, saw revenue fall 5% to $8.1 billion.
One analyst firm downgraded the stock to neutral the next morning with a report titled "Not fixed yet." Even after the drop, Intel trades at around 30 times 2027 earnings estimates, which some investors still see as rich for a company that is losing money in its foundry business.
Why it spread beyond one stock
If Intel had fallen alone, this would be a story about a single company. It wasn't alone. The Philadelphia Semiconductor Index dropped more than 7% in the same session, and chip stocks overseas sold off too.
The reason is a worry that has been building for weeks: are the huge sums being spent on artificial intelligence going to pay off, and when?
Look at what the big tech names have said in recent days:
Meta reported $34.91 billion in capital spending for the quarter and said it expects to spend between $135 billion and $145 billion for the year.
Tesla cut its full-year capital spending guidance to $20 billion from more than $25 billion, which raised questions about the pace of its AI and robotics projects.
Amazon and Alphabet also posted results that disappointed investors, deepening the unease.
One market analyst put the mood neatly, saying investors are running out of patience with AI spending that comes with a big price tag and a vague payback date. His view was that the AI trade will become more selective, rewarding companies that can turn adoption into profitable revenue. That's a reasonable summary of the shift. Nobody is saying AI isn't real. The argument is about the economics, and about whether stocks have already priced in a best-case outcome.
The index has gone nowhere
Zoom out and the picture is stranger still. The S&P 500 now sits almost exactly where it did five months ago, closing just one penny above that earlier level. In between, it set a record close of 7,818.93, and it's now about 3% below that peak. It has also finished three weeks in a row in the red.
Five months of volatility, and no net progress. If it has felt like the market keeps asking for your attention without paying you for it, the numbers agree.
The real story: money is rotating, not leaving
The headline index numbers hide something important. Over the month, the S&P 500 lost 0.9%, the Dow Jones actually gained 1.7%, and the Nasdaq dropped roughly 6.6%. That gap came from where money moved:
Energy: up 13.8%
Consumer staples: up 10.9%
Technology: down 8.2%
Communication services: down 9.9%
The equal-weight S&P 500 gained 4.9% while the regular cap-weighted index fell 0.9%. That 5.8-point difference is the widest since 2009. In plain terms, the average stock did fine. A handful of giant tech and communication names did the damage, and because they carry so much weight in the index, the headline looked worse than most portfolios felt.
It also explains why energy led. Brent crude has been trading above $110 a barrel, and defensive sectors like staples tend to attract buyers when growth stocks get shaky.
The macro backdrop
A few other pressures are sitting on the market at the same time:
Rates are staying put. The Federal Reserve held its benchmark rate unchanged at its latest meeting, and the 10-year Treasury yield is hovering around 4.9%. High yields make expensive growth stocks harder to justify, because safer assets pay more.
Oil is elevated. High crude prices feed inflation worries and keep the Fed cautious.
Expectations were sky-high. Analysts walked into the reporting season expecting S&P 500 profits to be up close to 30% from a year earlier. When the bar is that high, even decent results can disappoint, and a weak forecast gets punished hard. Intel is a textbook example.
None of this is a crisis. The Fed isn't hiking, and many earnings reports have been solid. But it's a market with very little room for error.
What investors can take from this
It's easy to react to a day like this with fear or with a rush to buy the dip. A calmer approach is to ask what the session actually taught us.
Concentration cuts both ways. When a few mega-caps drive the index higher, they can drive it lower just as quickly. Check how much of your own portfolio depends on one theme.
Guidance matters more than results. Intel beat on the quarter and still lost almost a third of its value. The market is watching forecasts, not the rearview mirror.
Rotation is normal. Leadership changes, and portfolios built around a single story can lag fast. Equal-weight and defensive holdings had a very different month from tech-heavy ones.
Expensive stocks need perfect news. After a 150% run, any wobble gets magnified.
If you'd like to see how this kind of rotation plays out without putting your own money on the line, that's what simulated portfolios are for. On Odin500 you can follow AI-managed paper portfolios and watch how different approaches handle weeks like this one, from tech-heavy builds to more balanced ones.
What to watch next
Traders are focused on two levels. On the downside, the recent weekly low near 7,525 is the line many are watching. On the upside, the record close just under 7,820 is the number to beat.
The bigger signals will come from earnings and guidance. If more large companies show that their AI spending is turning into real cash flow, this episode may be remembered as a pause. If forecasts keep getting cut, the market could decide that the AI story needs a lower price tag. Either way, expect the reaction to results to matter as much as the results themselves.
This article is for educational purposes only and is not investment advice.