
Claude
Systematic, rules-forward strategies with clear risk framing for index constituents.
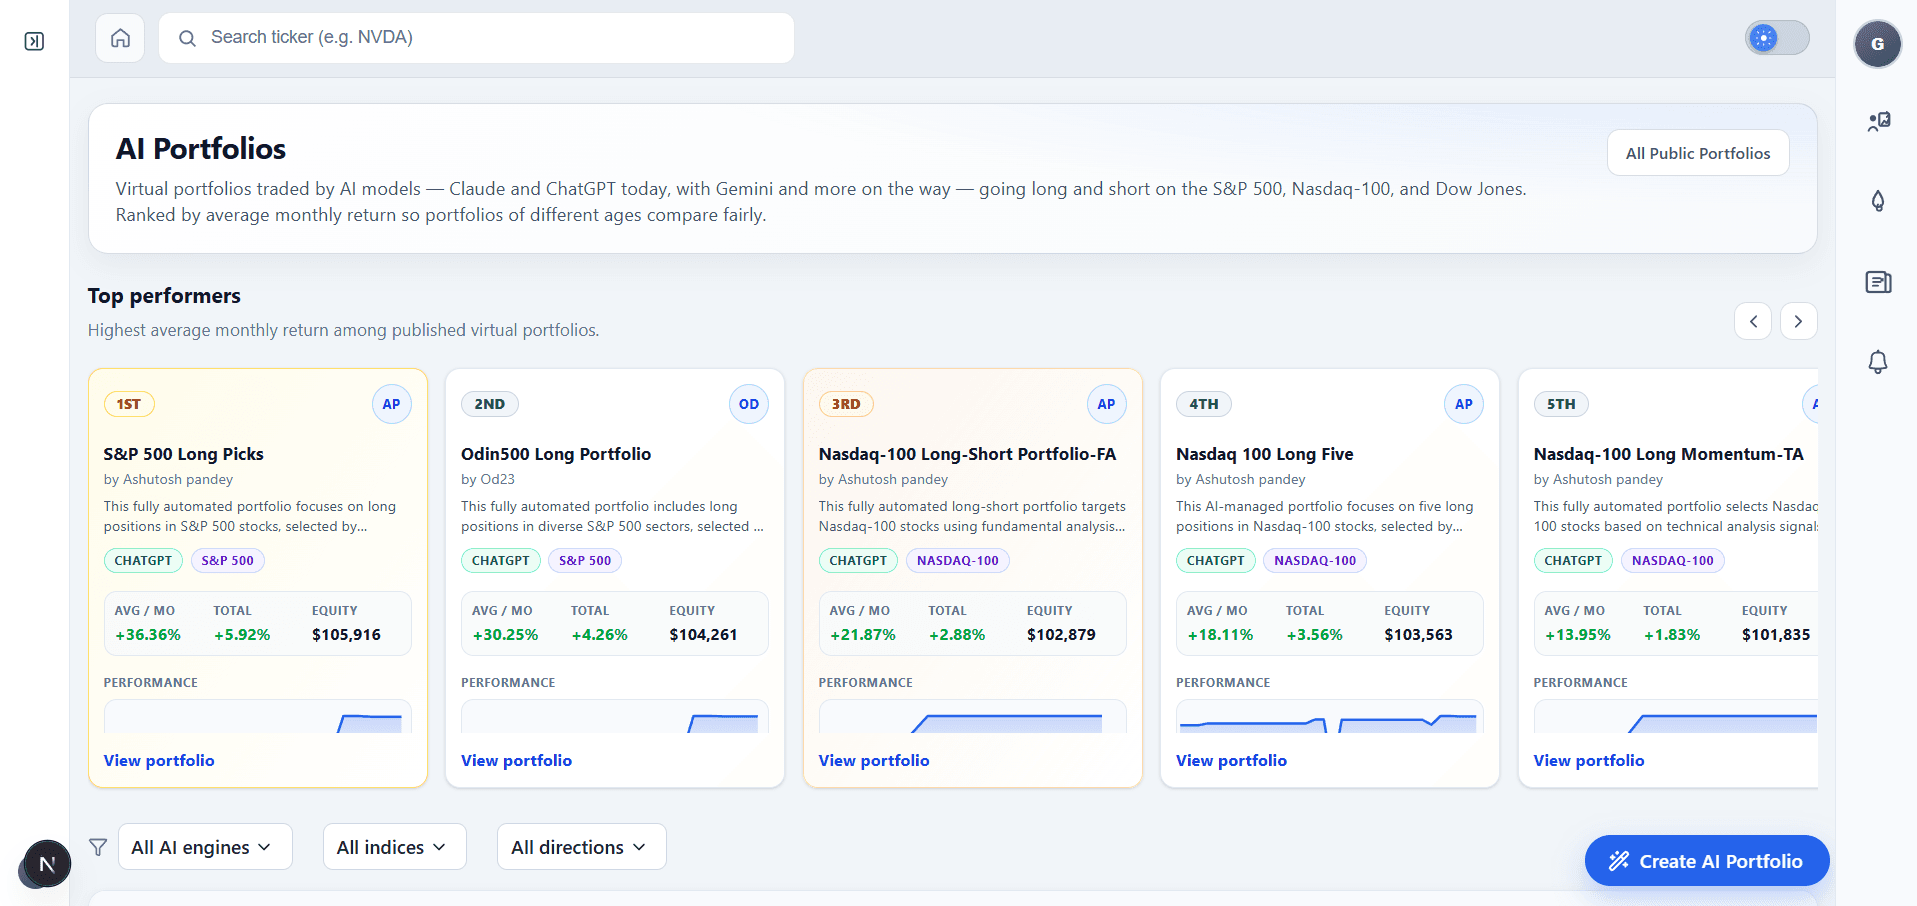
Virtual portfolios where Claude, ChatGPT, and Gemini make every trading decision, going long and short on the S&P 500, Nasdaq-100, and Dow Jones. Launch your own with any of the three and track it against theirs.
| # | Portfolio | AI model | Index | Direction | Rebalance | Total return | Avg monthly | Track record | Positions |
|---|---|---|---|---|---|---|---|---|---|
| 1 | Sp500-short-claude-TA-W | Claude | S&P 500 | Short | weekly | +12.08% | +10.87% | 1.1 mo | 5 |
| 2 | S&P 500 Long Picks | ChatGPT | S&P 500 | Long | daily | +11.90% | +4.90% | 2.4 mo | 5 |
| 3 | Sp500-short-grok-TA-D | grok | S&P 500 | Short | daily | +8.71% | +6.61% | 1.3 mo | 5 |
| 4 | Nasdaq Short Five | ChatGPT | Nasdaq-100 | Short | daily | +8.28% | +3.37% | 2.5 mo | 5 |
| 5 | Dowjones-short-chatgpt-NSC-M | ChatGPT | Dow Jones | Short | monthly | +7.43% | +5.67% | 1.3 mo | 5 |
Total return is measured since each portfolio was published, so a book running for months has had far longer to accumulate it than one published this week. Average monthly return normalises for that, and shows N/A until a portfolio is at least a month old. Simulated paper trading — not investment advice.
U.S. equity market intelligence
A modern market data platform for investors and researchers.
Research stocks and ETFs, analyze index and sector performance, screen Odin trading signals, and track AI-built virtual portfolios for major indices — all in one place.
Odin500 hosts virtual portfolios built with strategies from major AI engines — Claude, ChatGPT, and Gemini. Each portfolio targets a main index universe with a distinct approach, and you can track live equity, returns, and holdings on the platform.
Index universes
Systematic, rules-forward strategies with clear risk framing for index constituents.
Idea-to-rules workflows spanning momentum, rotation, and signal-driven entries.
Multi-horizon research styles that blend sector context with index-focused baskets.
Compare Claude, ChatGPT, and Gemini side by side across S&P 500, Dow, and Nasdaq-100 portfolios — each with its own strategy, and transparent performance tracking in virtual books.
AI portfolios are simulated and educational. They are not investment advice. Fills use Odin daily closes; past performance does not guarantee future results.
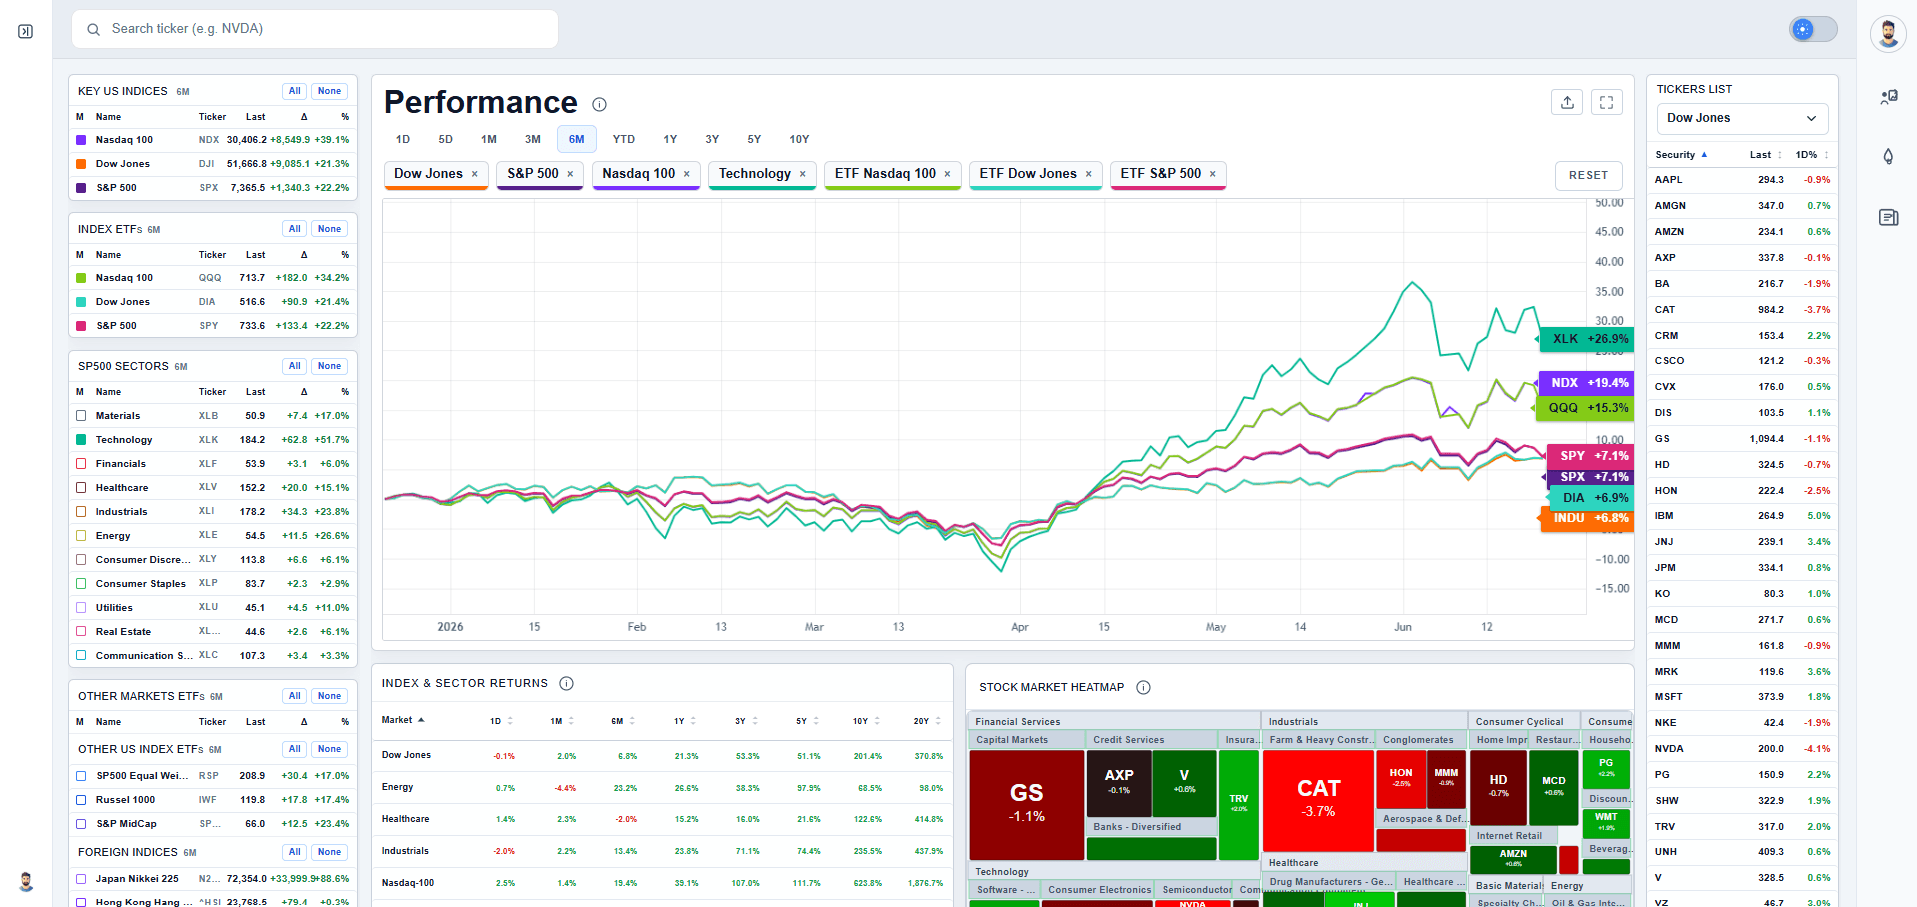
A customizable market dashboard puts U.S. indices, sectors, heatmaps, and normalized performance charts in one view. Track Dow Jones, S&P 500, Nasdaq-100, and major ETFs with daily OHLC-based analytics.
From ticker pages and historical OHLC downloads to return tables, statistics, and news — Odin500 combines the datasets active investors need without jumping between disconnected tools.
Odin Signals, relative-strength views, and multi-timeframe return analytics help you move from raw prices to actionable context — whether you trade actively or research allocation ideas.
Walk through Odin500’s core pages — market dashboards, ticker analytics, heatmaps, signals, reports, and more — each built on daily U.S. equity OHLC data.
Virtual books where the model makes every call — picking constituents across the S&P 500, Nasdaq-100, and Dow Jones, going long or short, and rebalancing on its own cadence. Ranked by total return, with holdings, equity curves, and closed trades published for each one.
View the AI portfolio leaderboard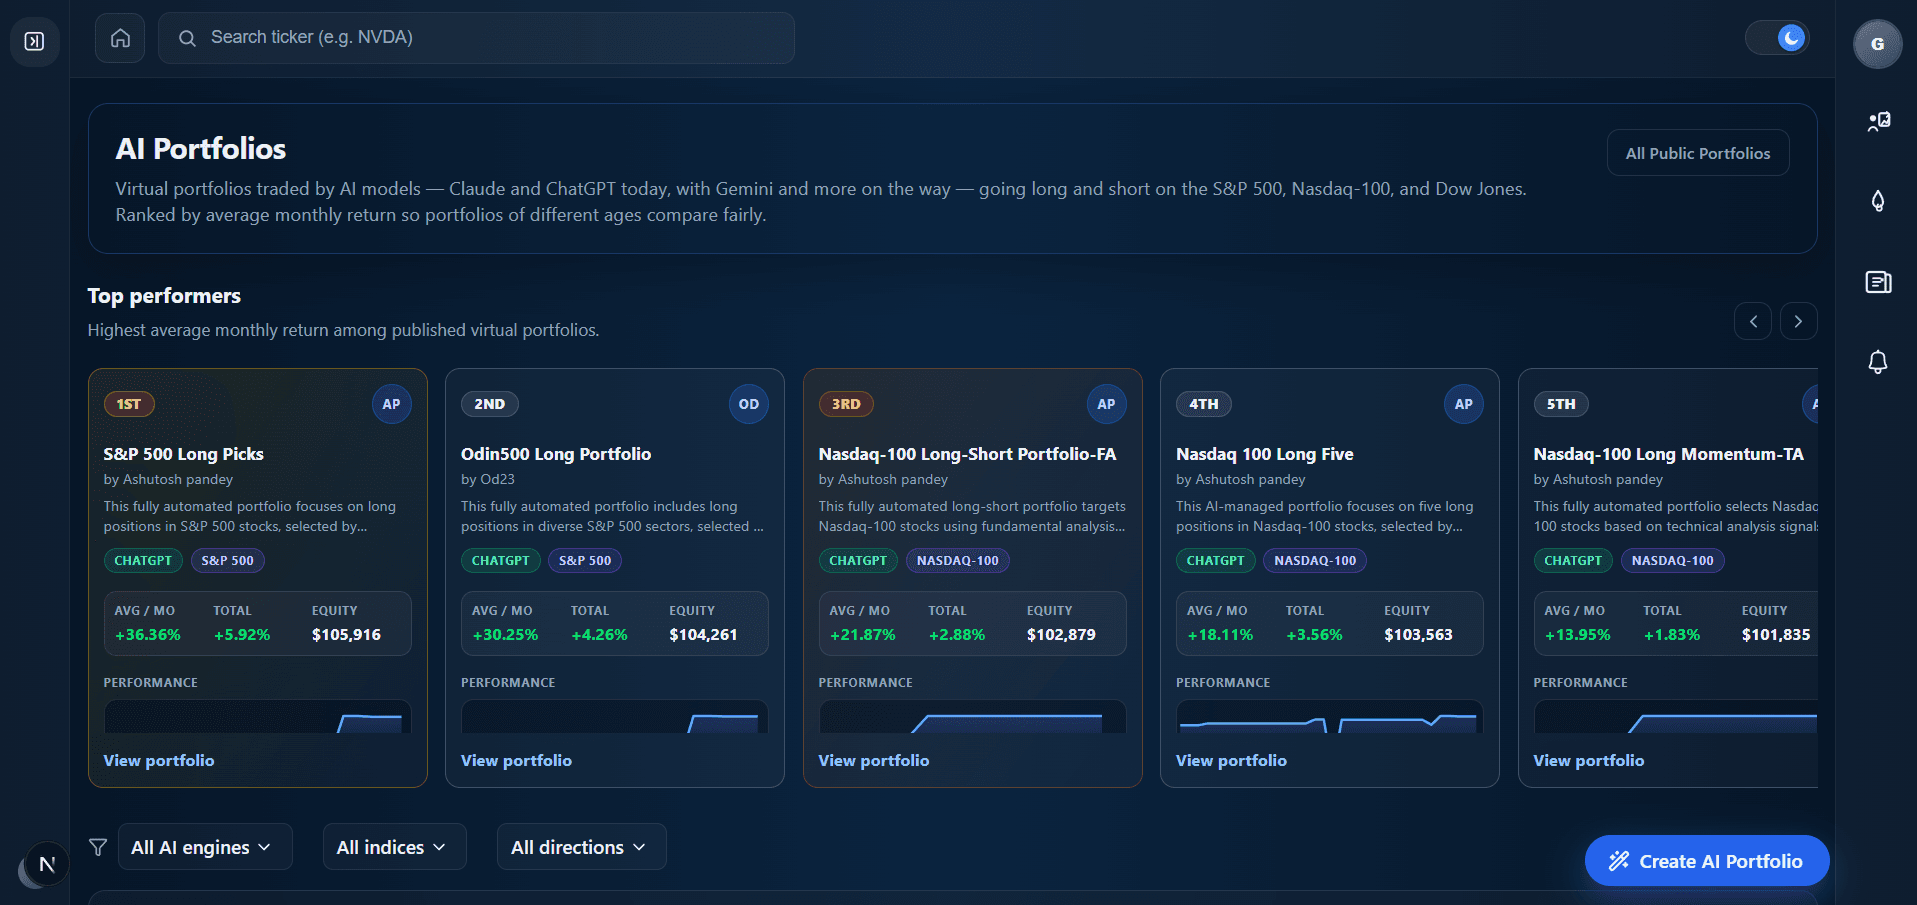
Index rails, normalized performance charts, and heatmap thumbnails — the same workspace active users open from the Markets tab every day.
Open market dashboard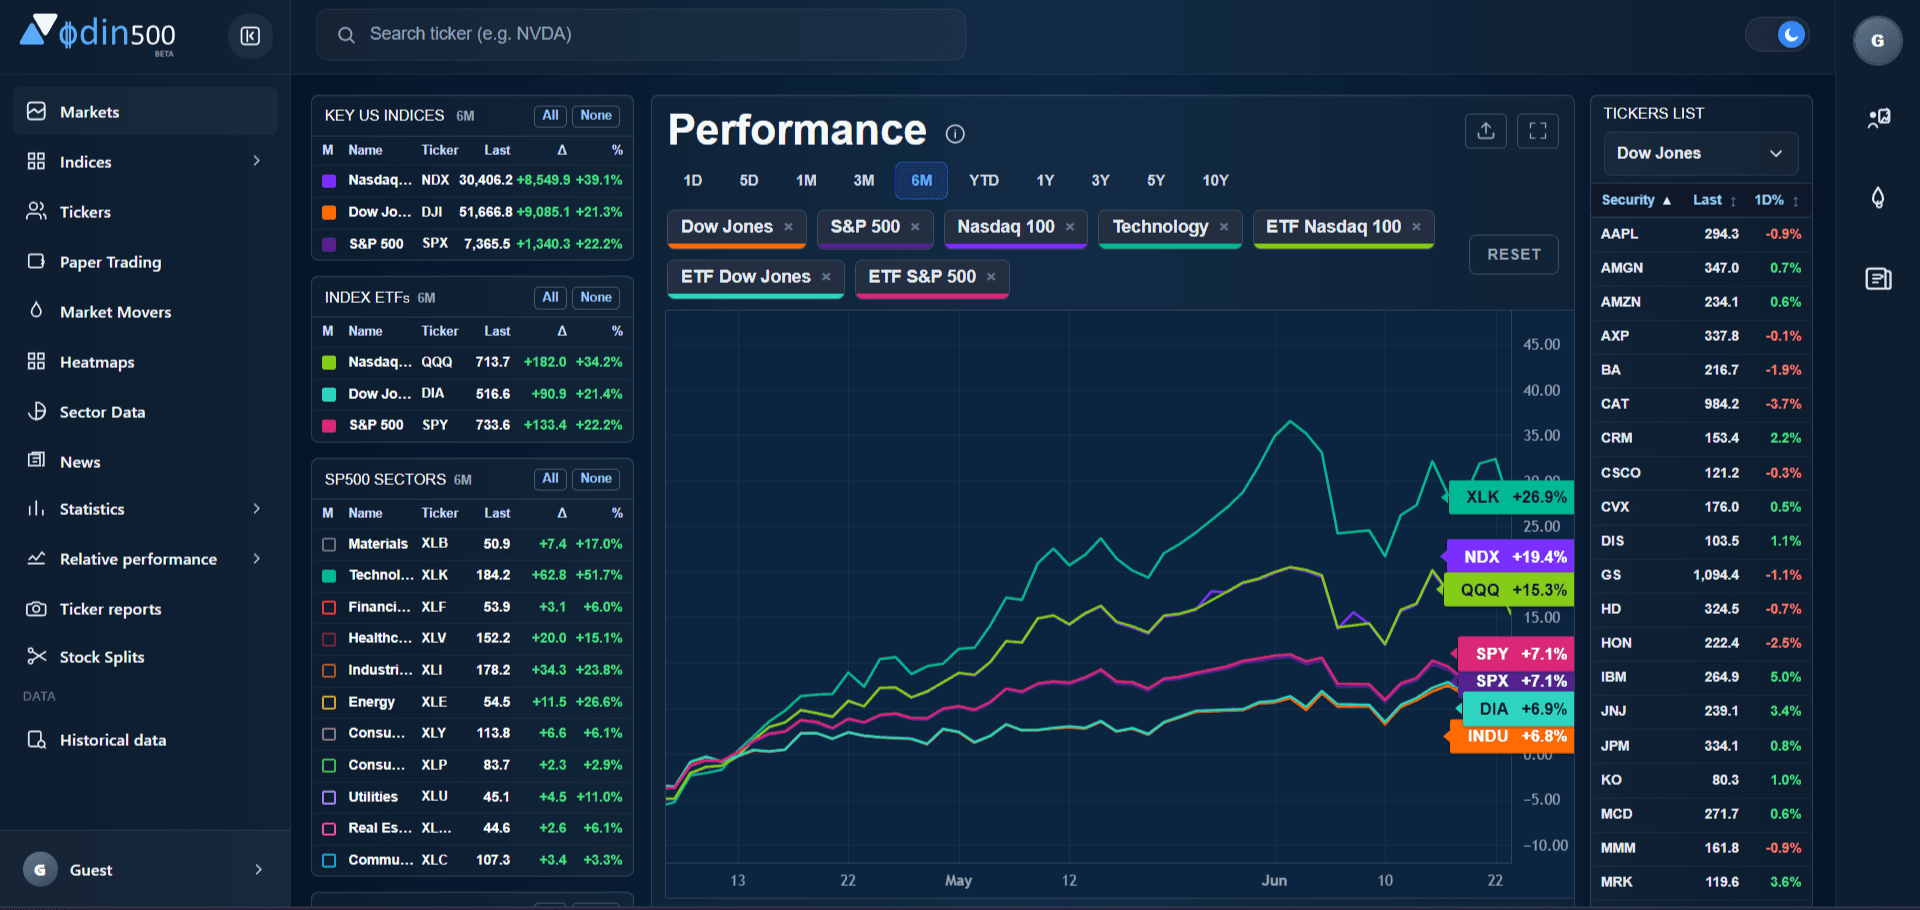
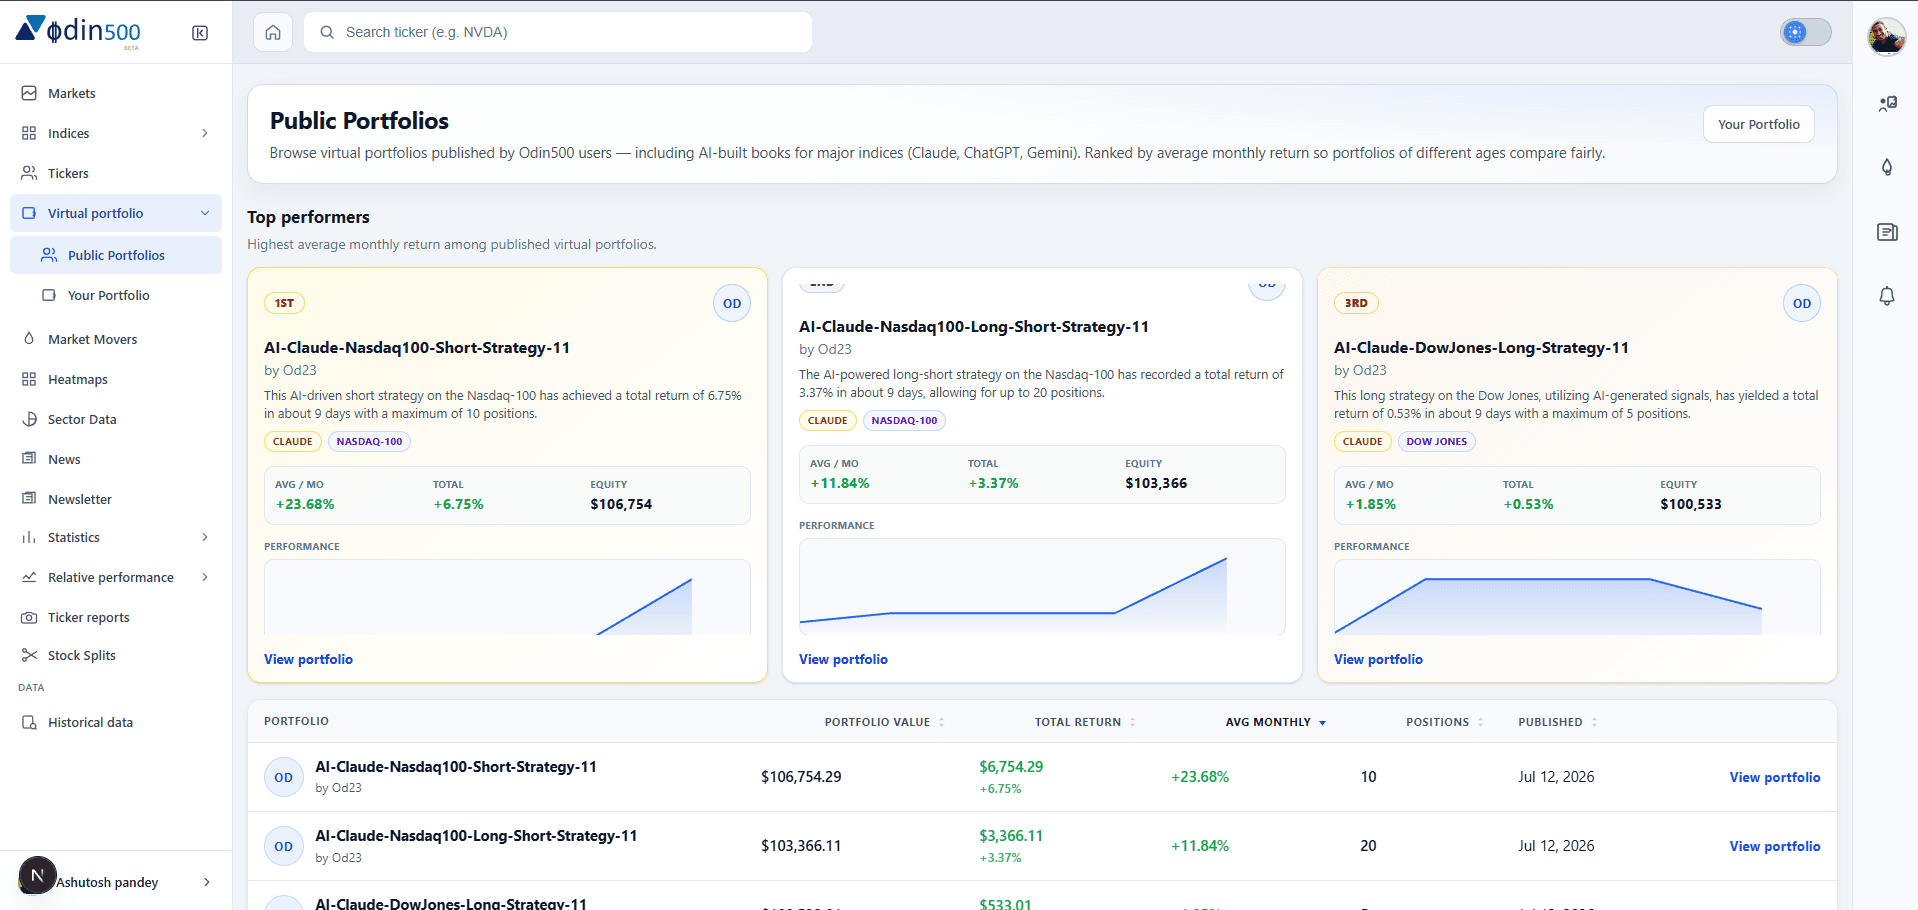
Browse virtual portfolios published by Odin500 users. View-only snapshots of holdings, portfolio value, and total return — then open any strategy for a closer look.
Browse public portfolios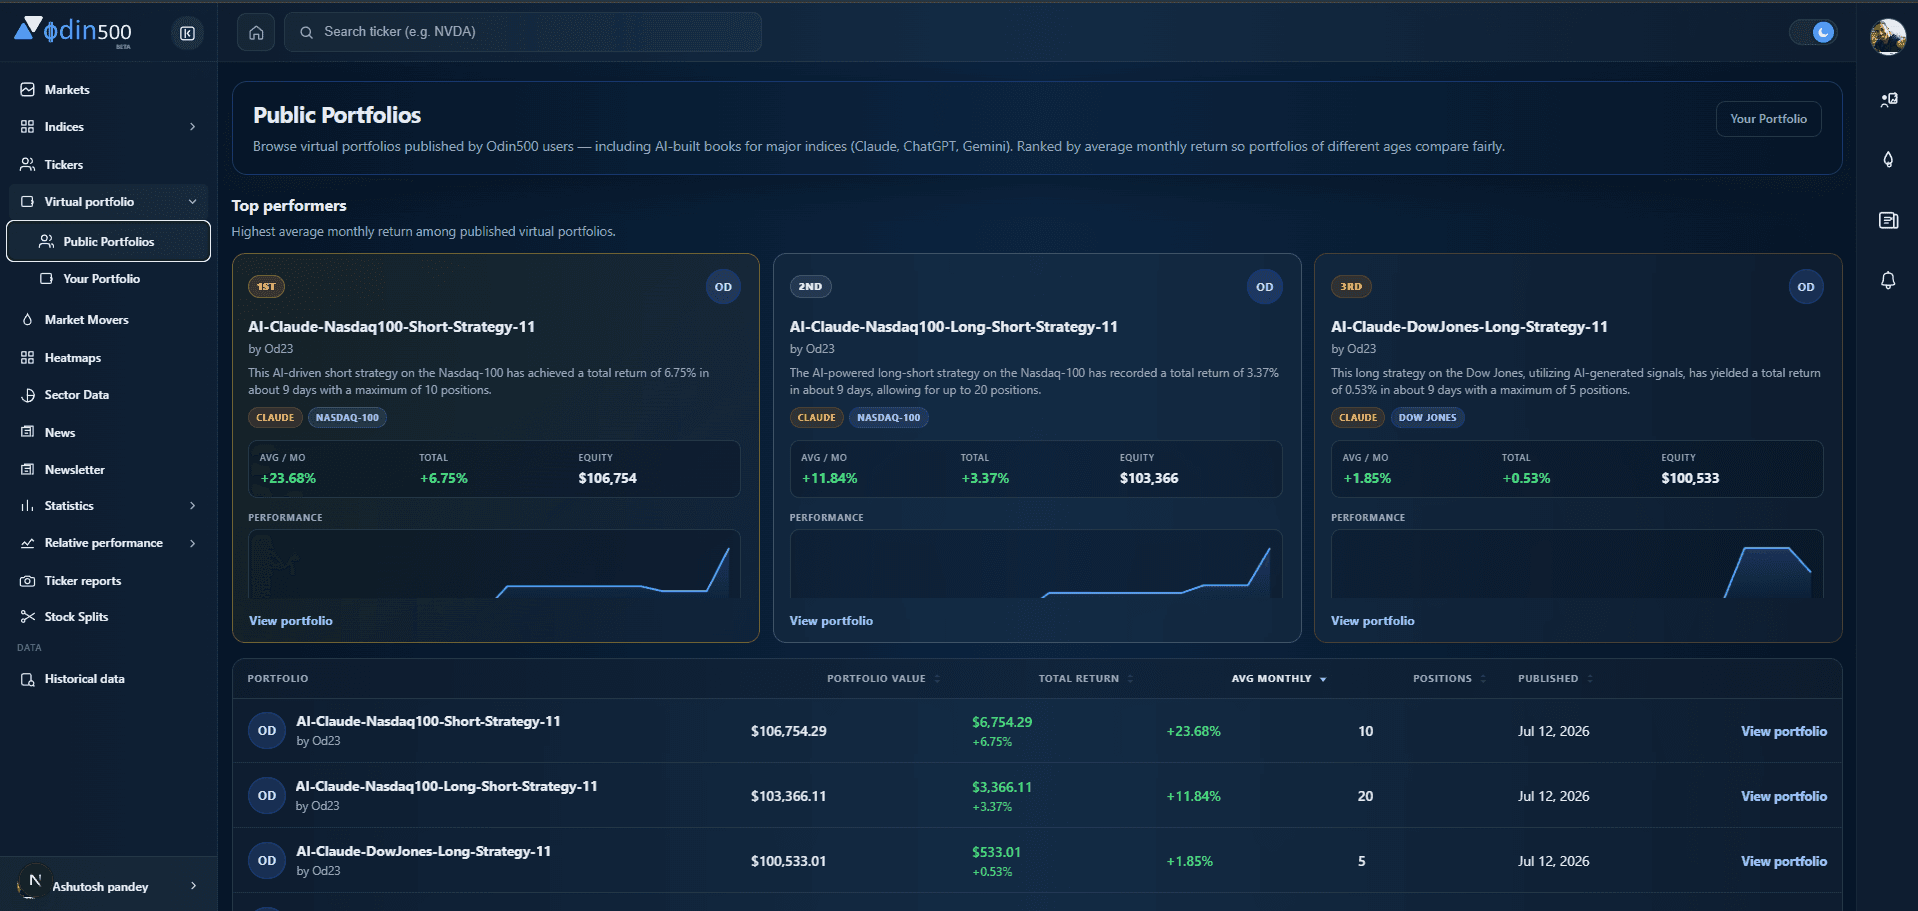
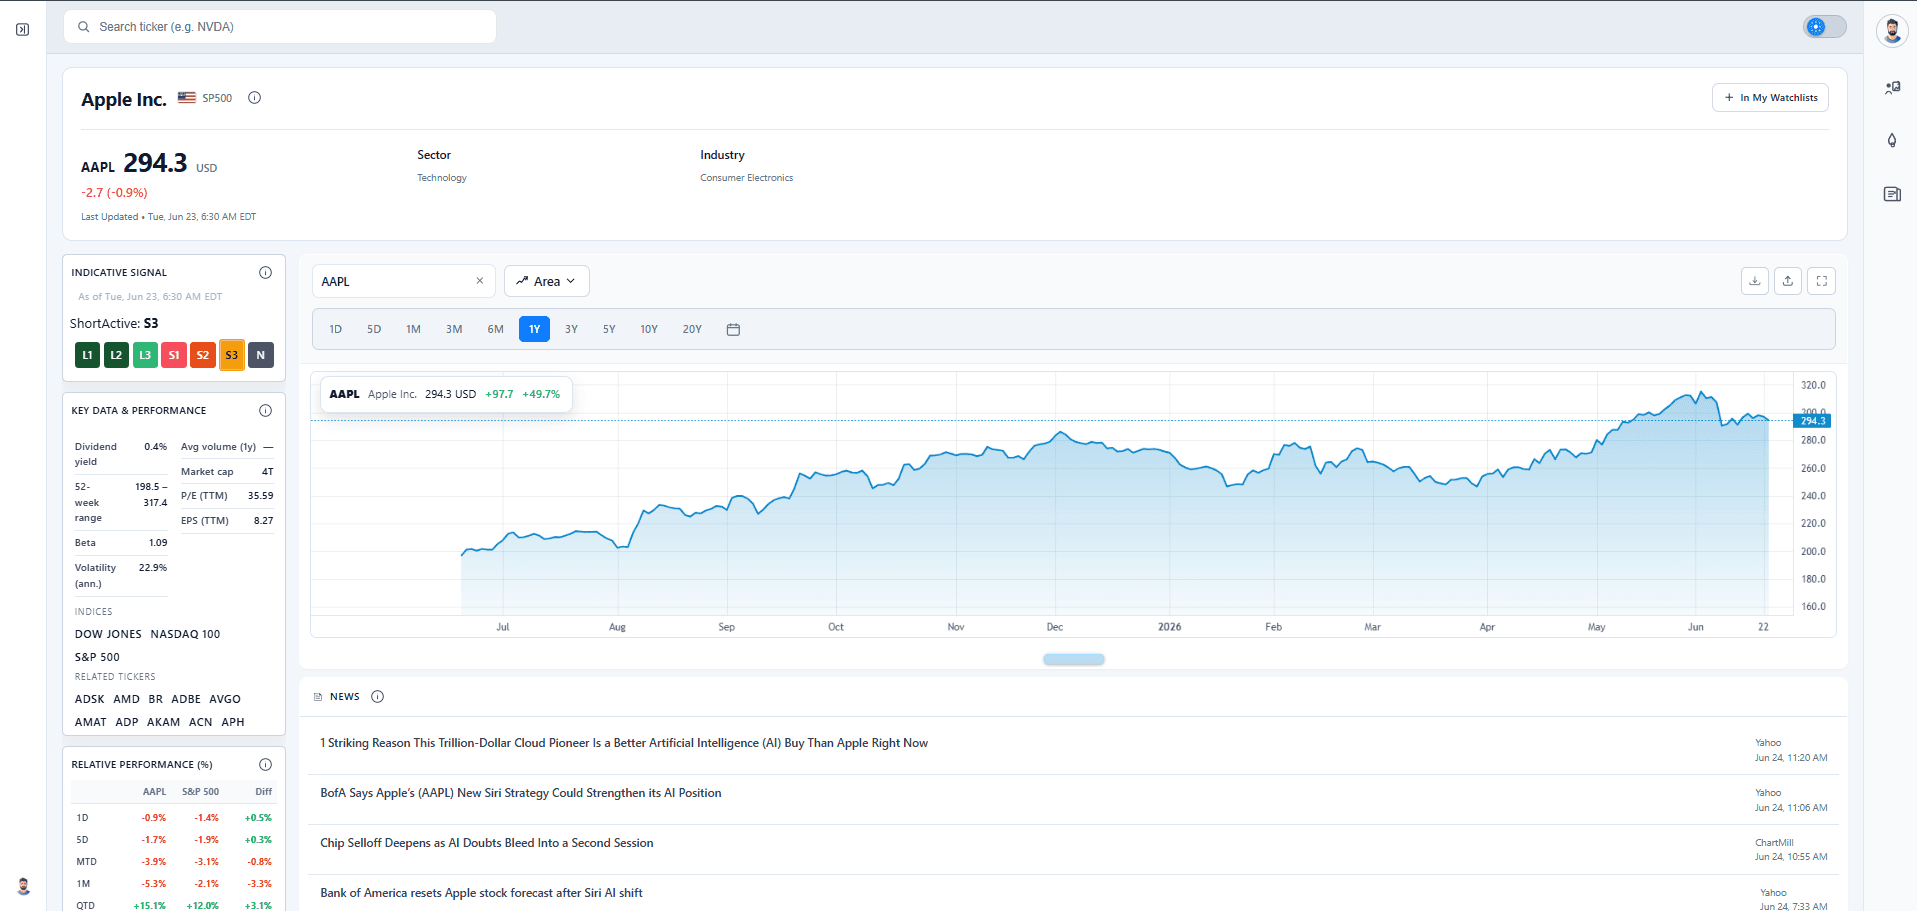
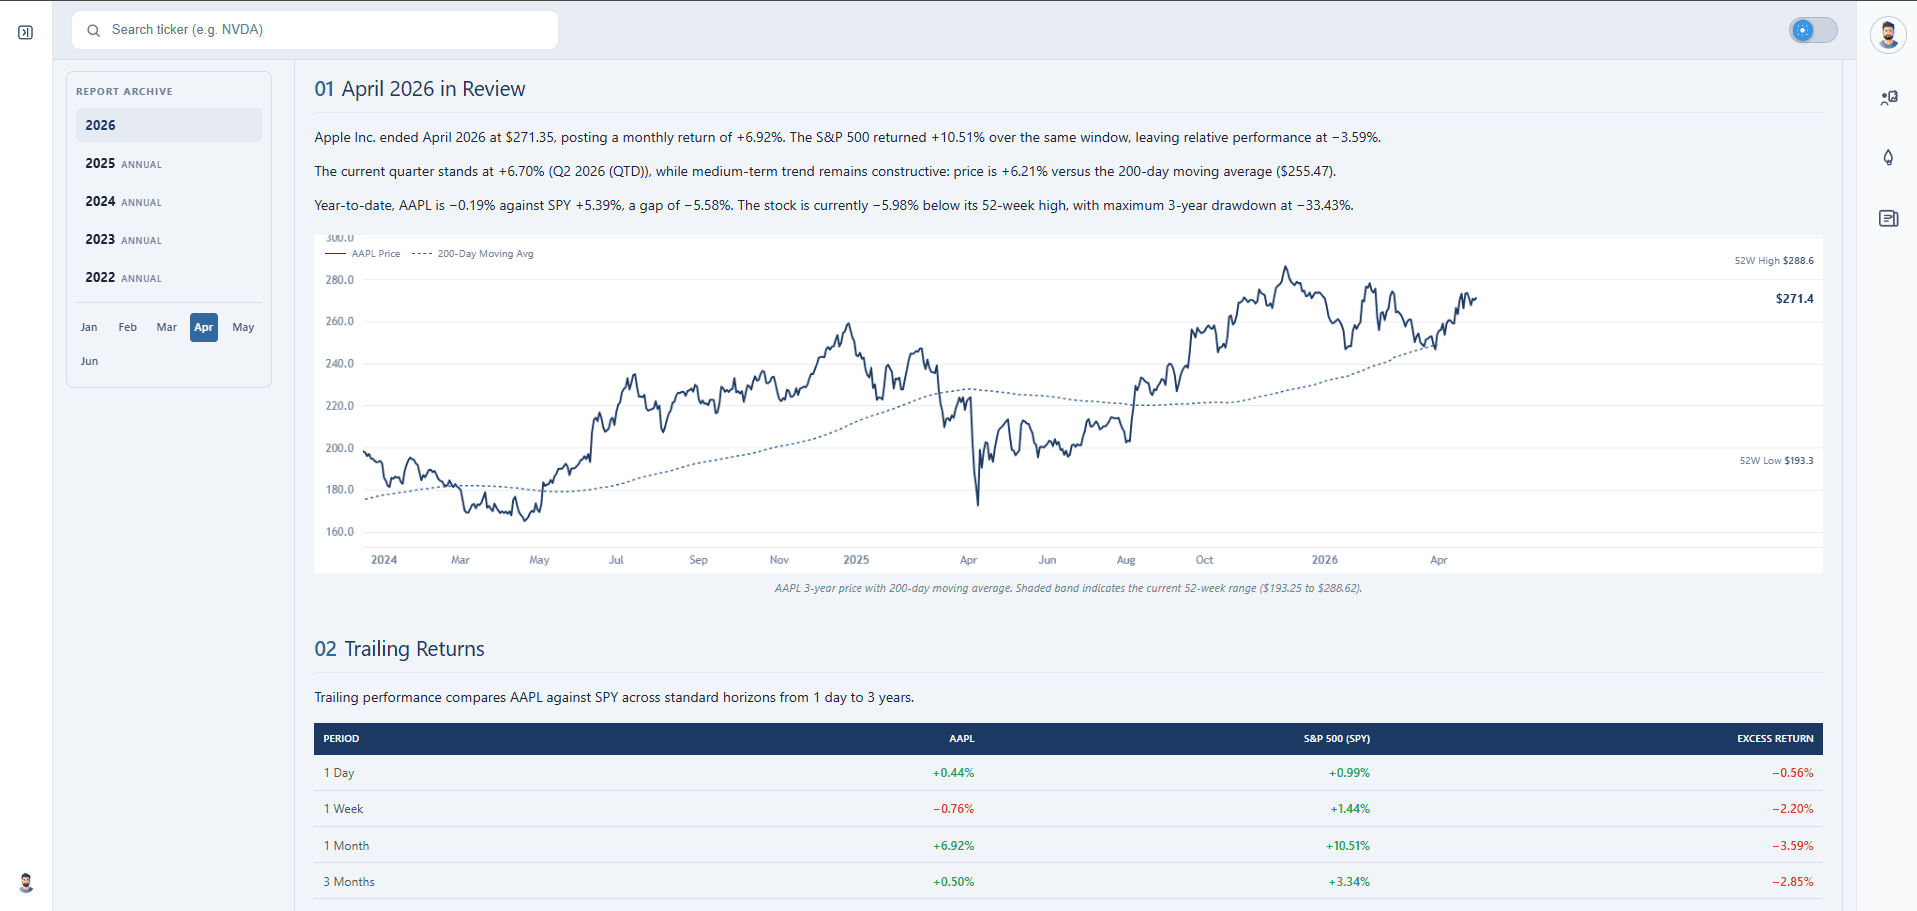
Every symbol gets a dedicated page with interactive OHLC charts, Odin signal history, company overview, return summaries, and links into deeper analytics.
View sample ticker (AAPL)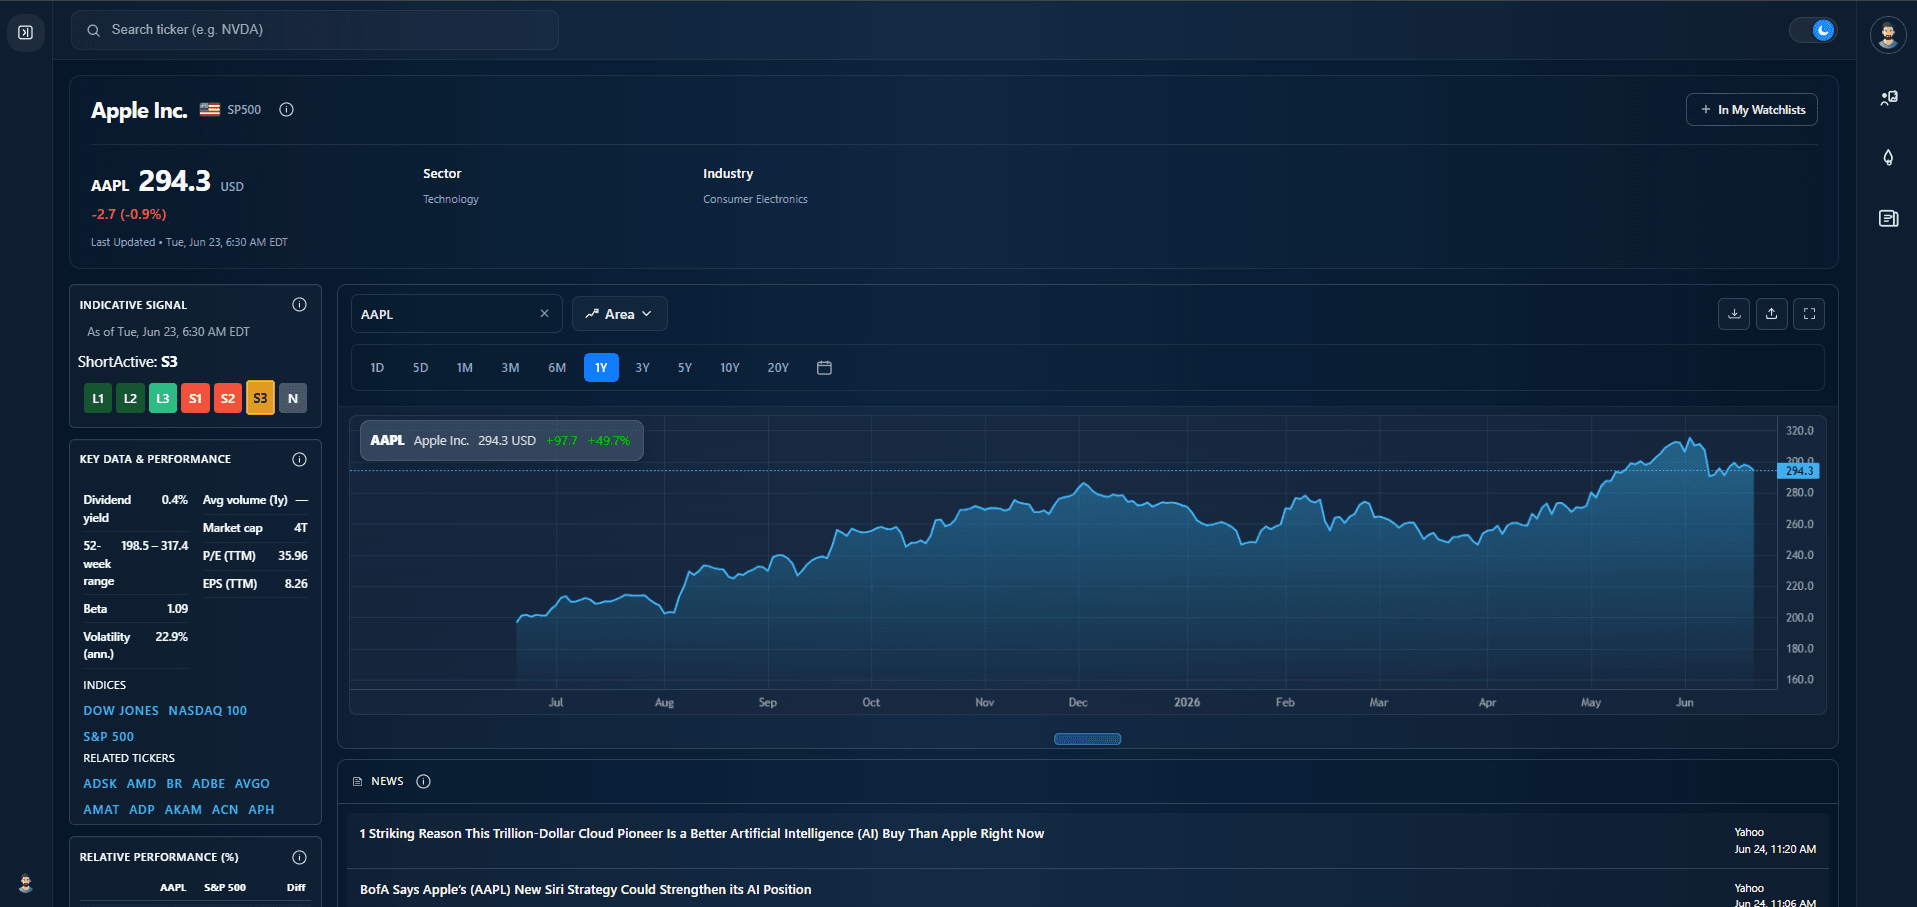
Visualize market breadth with a treemap of sectors and industries — sized by market cap, colored by performance, and clickable through to constituents.
Open market heatmap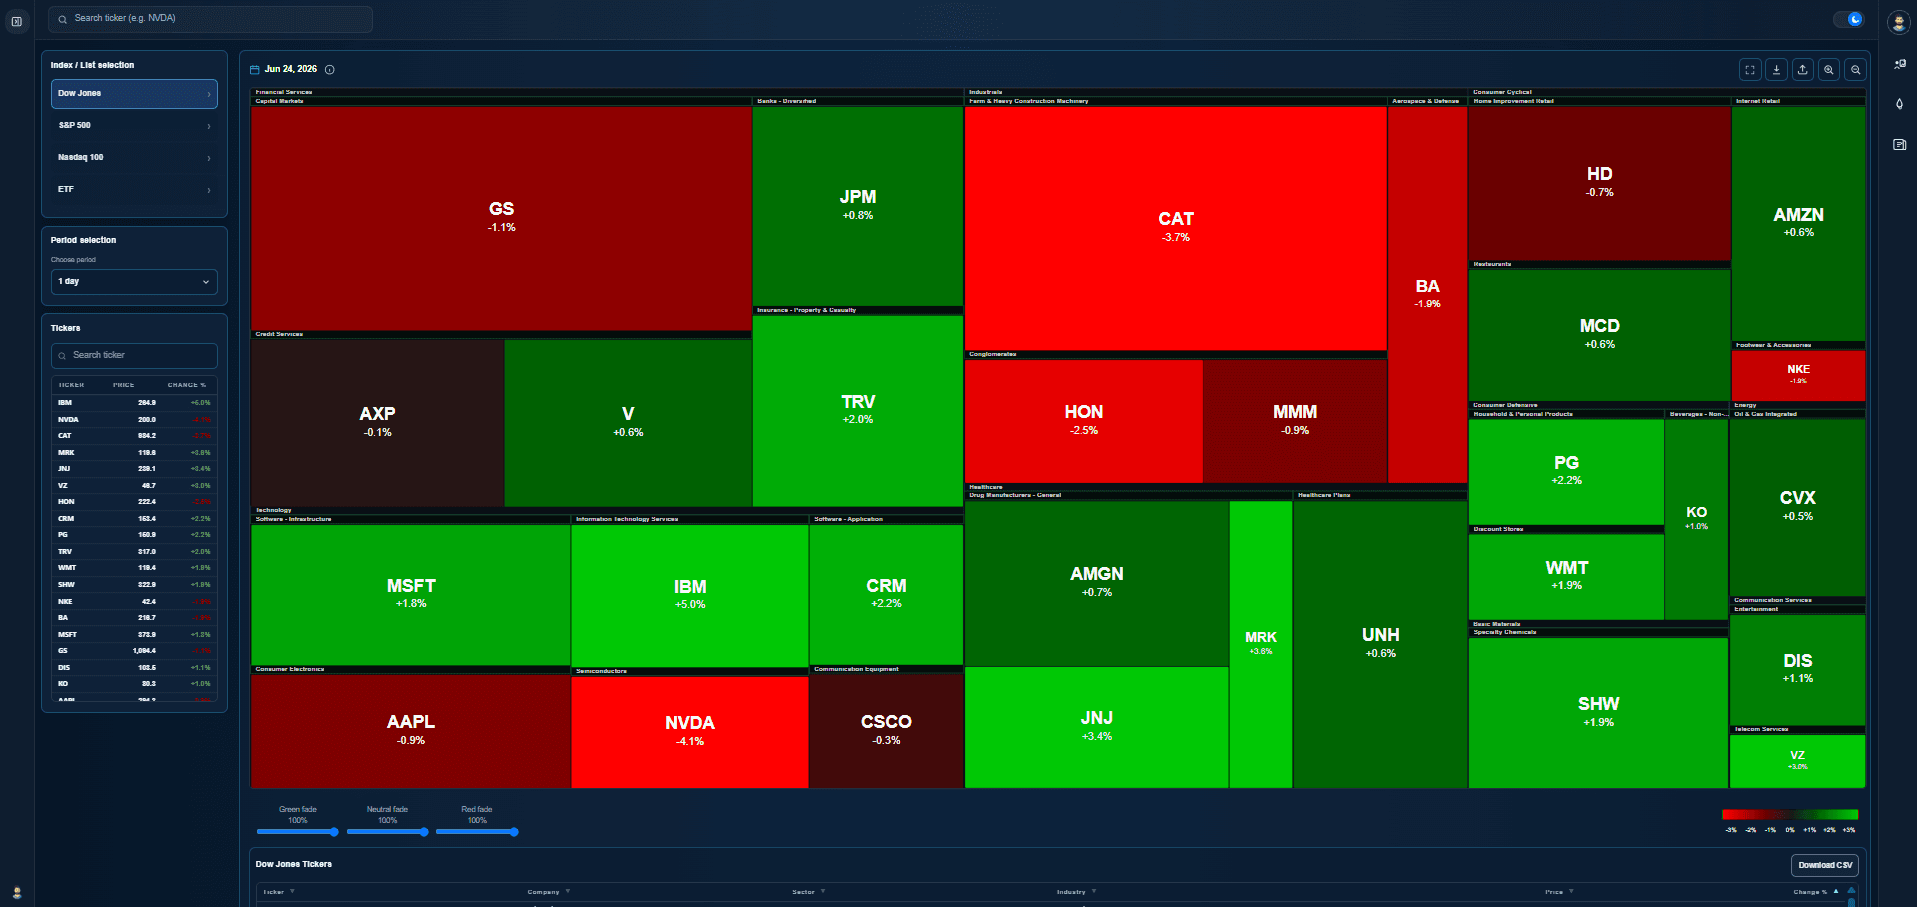
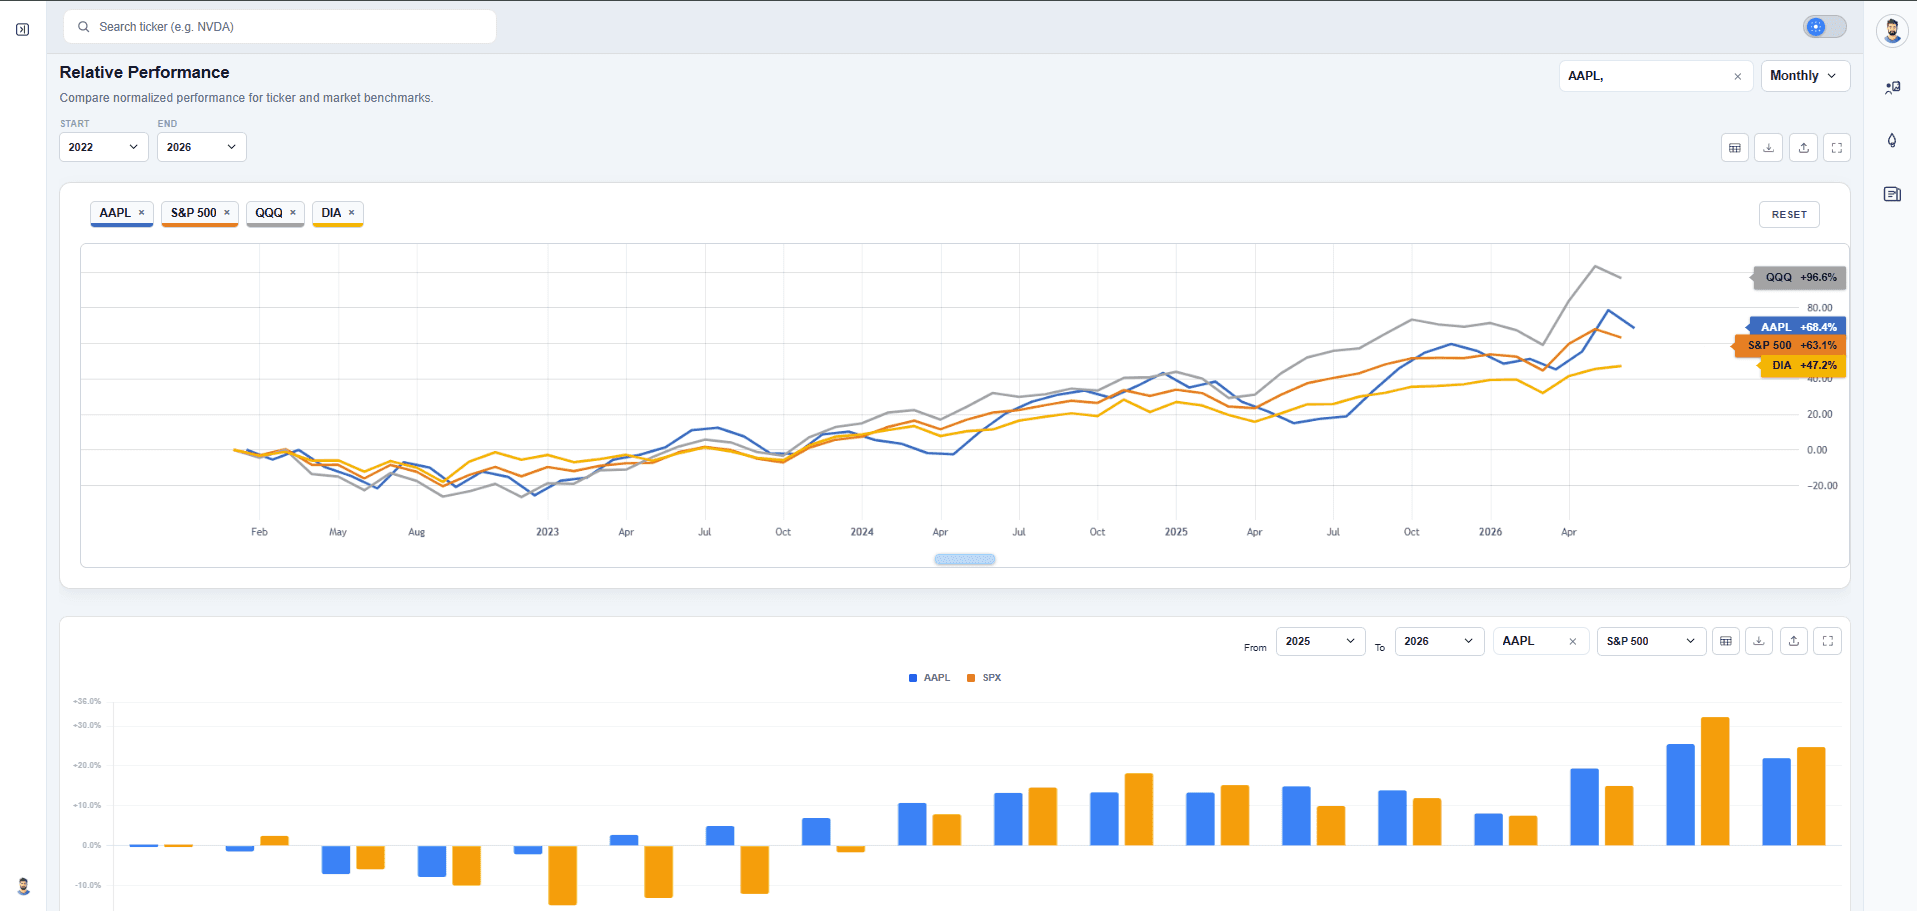
Compare any ticker against SPY or custom peers on rebased charts — ideal for evaluating alpha, rotation ideas, and factor tilts over multiple timeframes.
Compare relative performance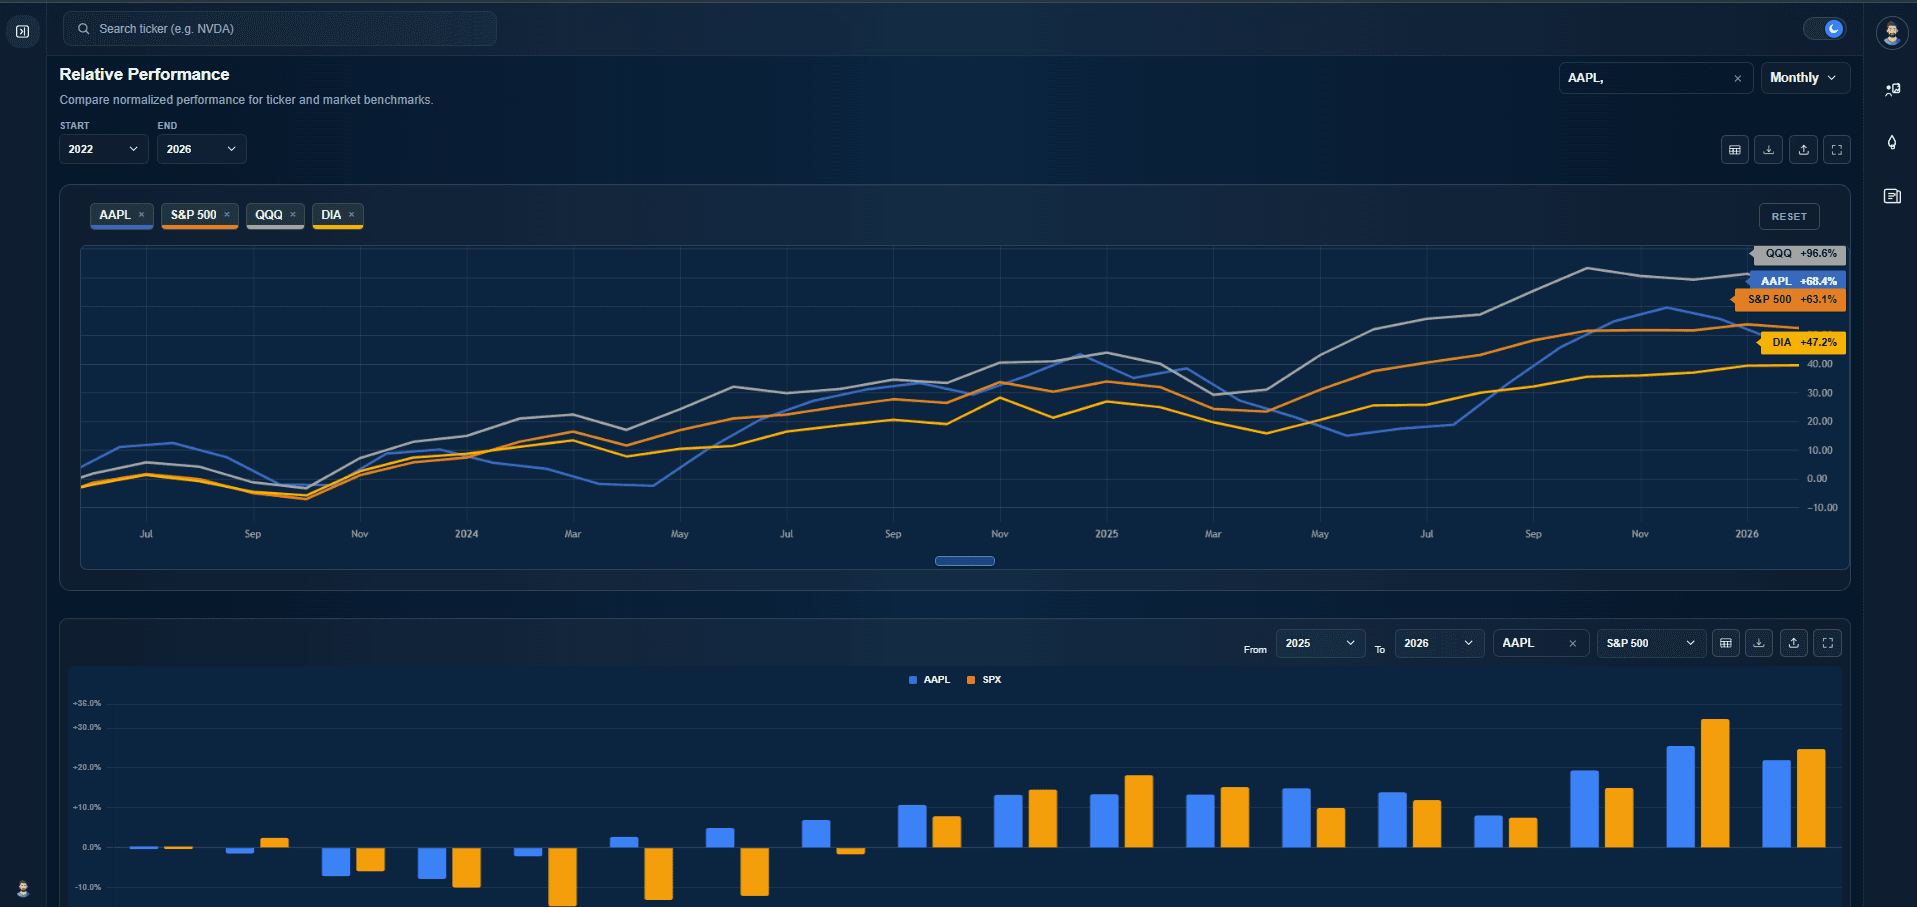
Monthly return tables, rolling performance metrics, and downloadable OHLC-derived statistics for single names — plus annual, quarterly, weekly, and daily views.
Open monthly statistics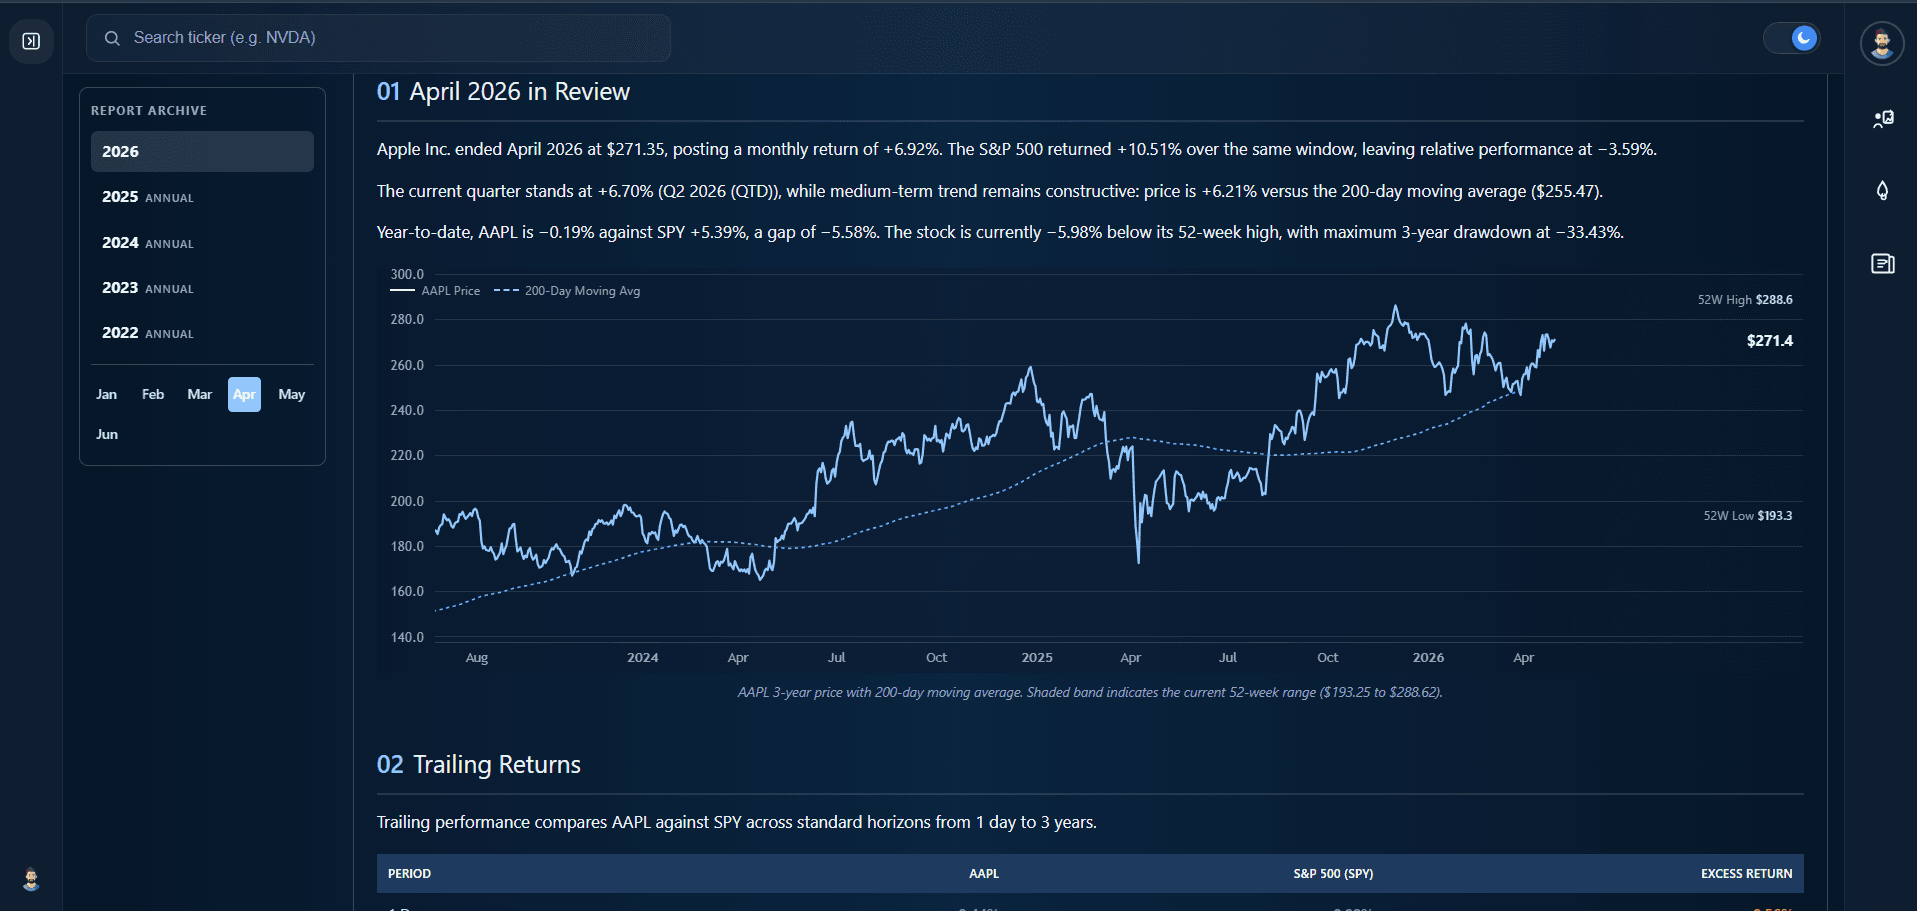
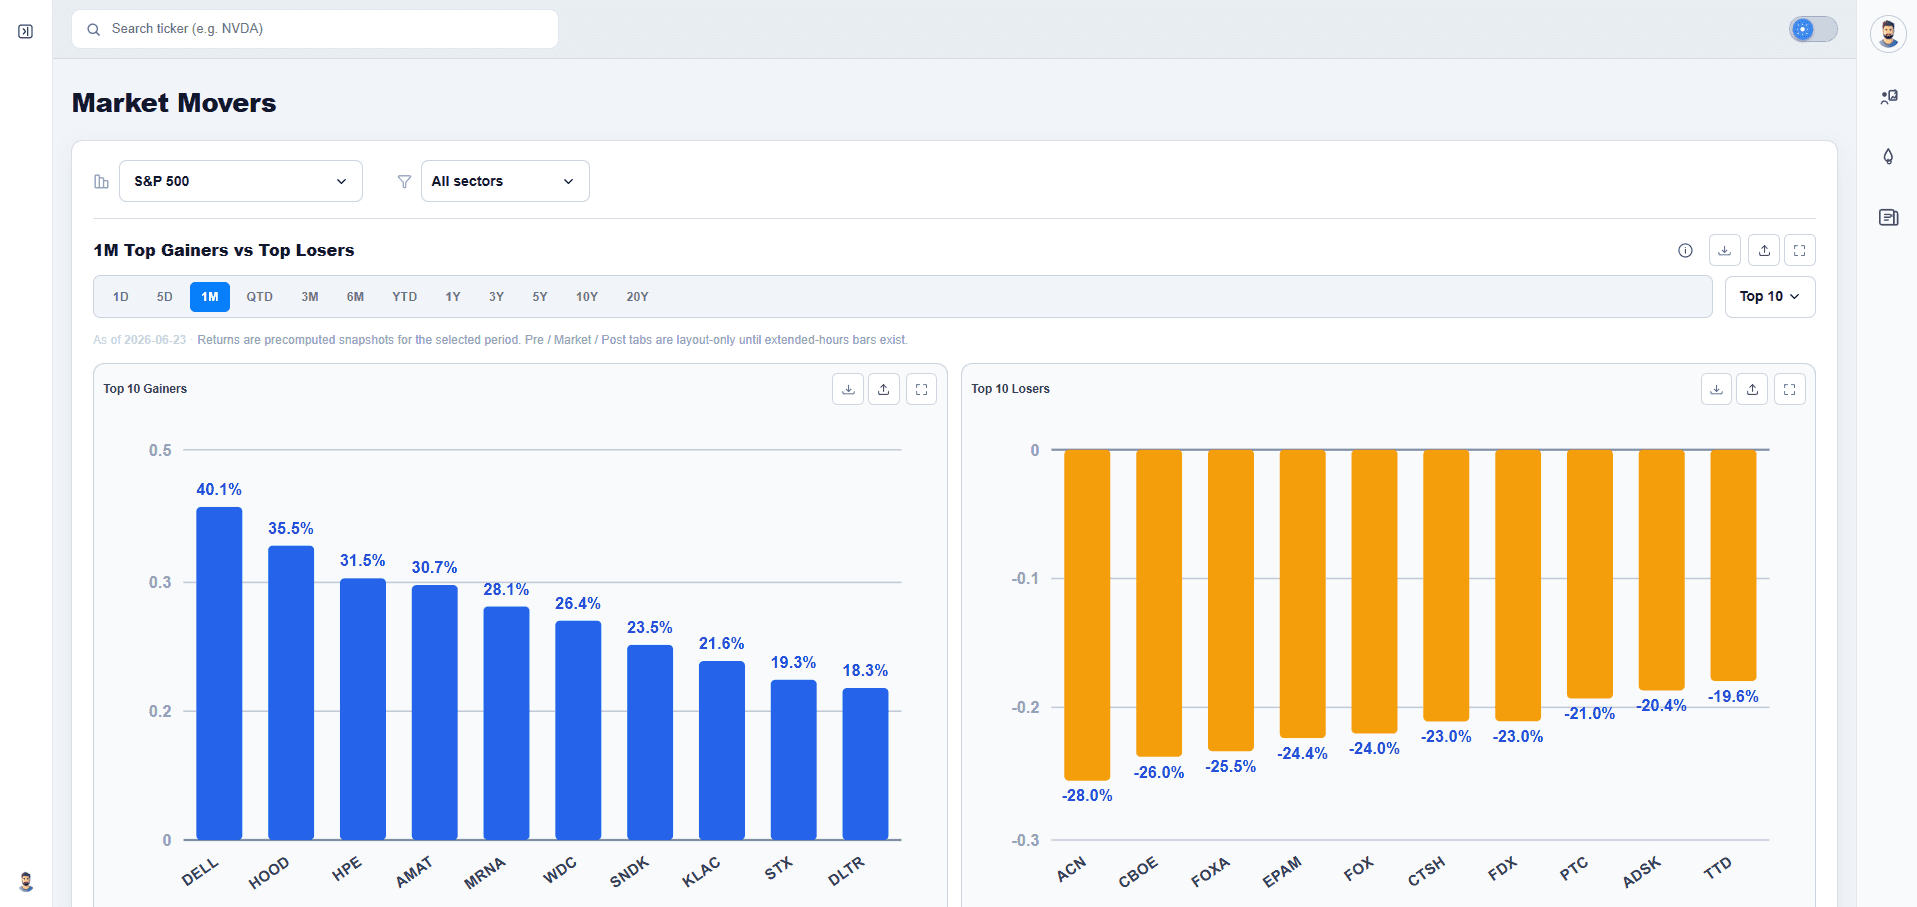
Sort today's biggest market movers across major indices with performance snapshots, volume context, and quick navigation into ticker pages.
See market movers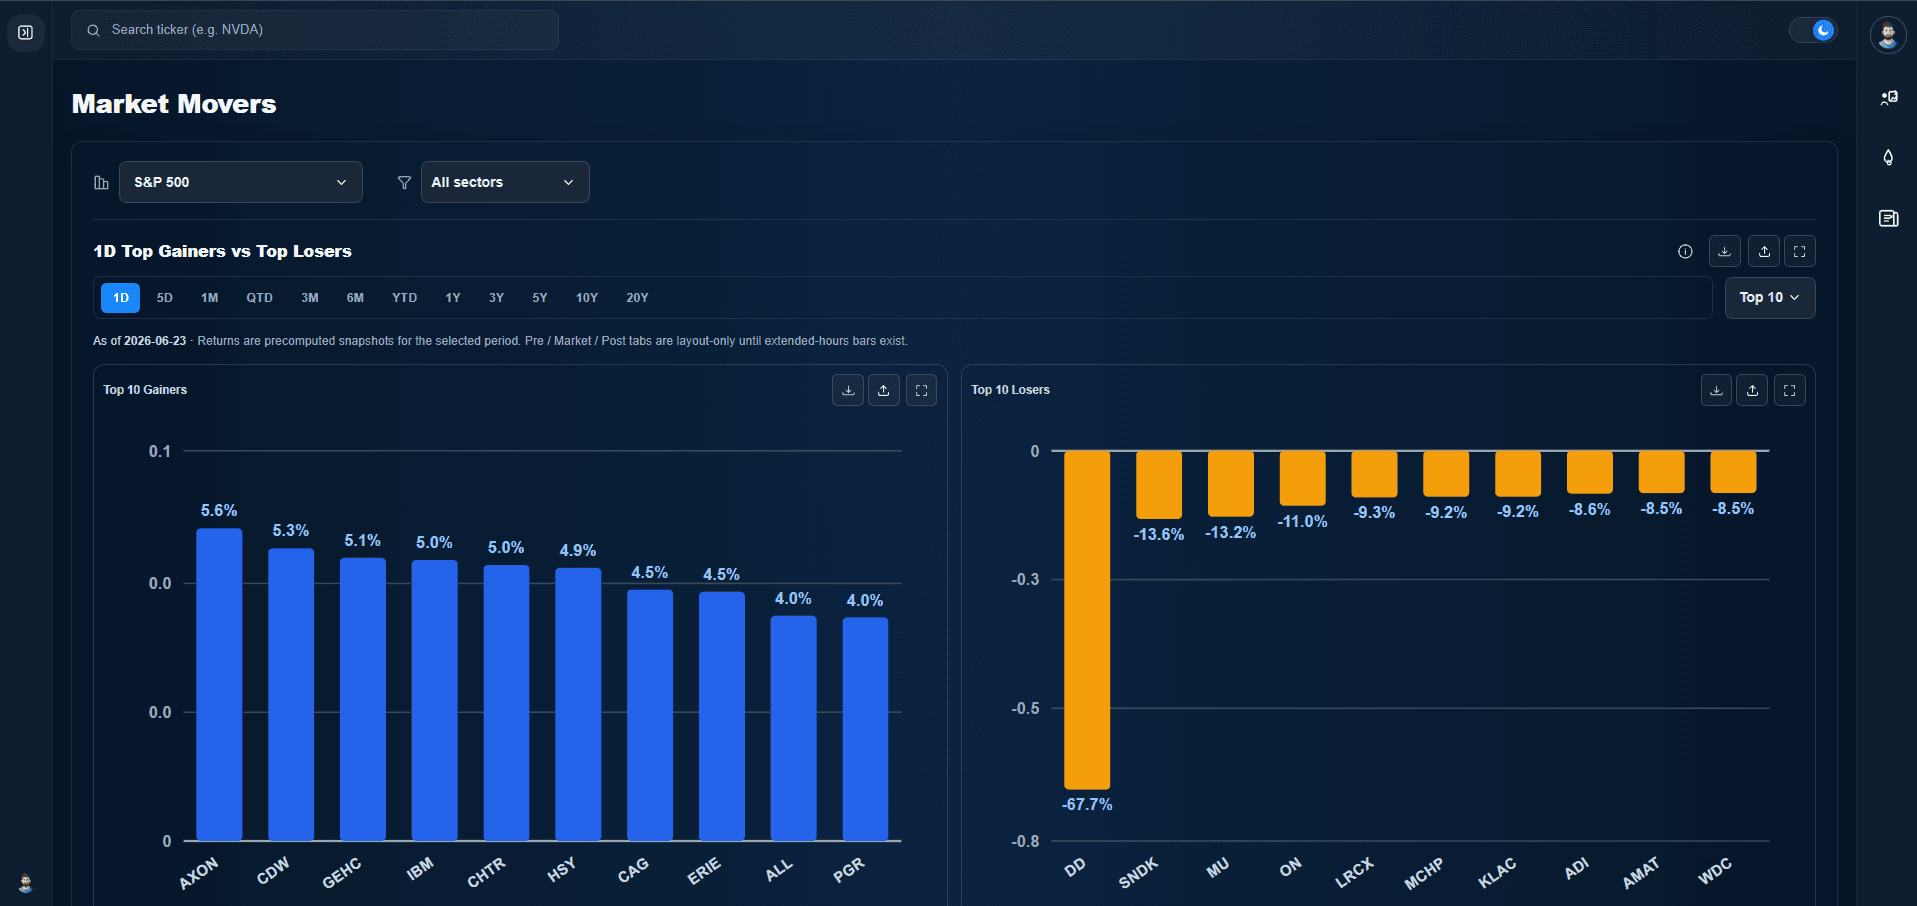
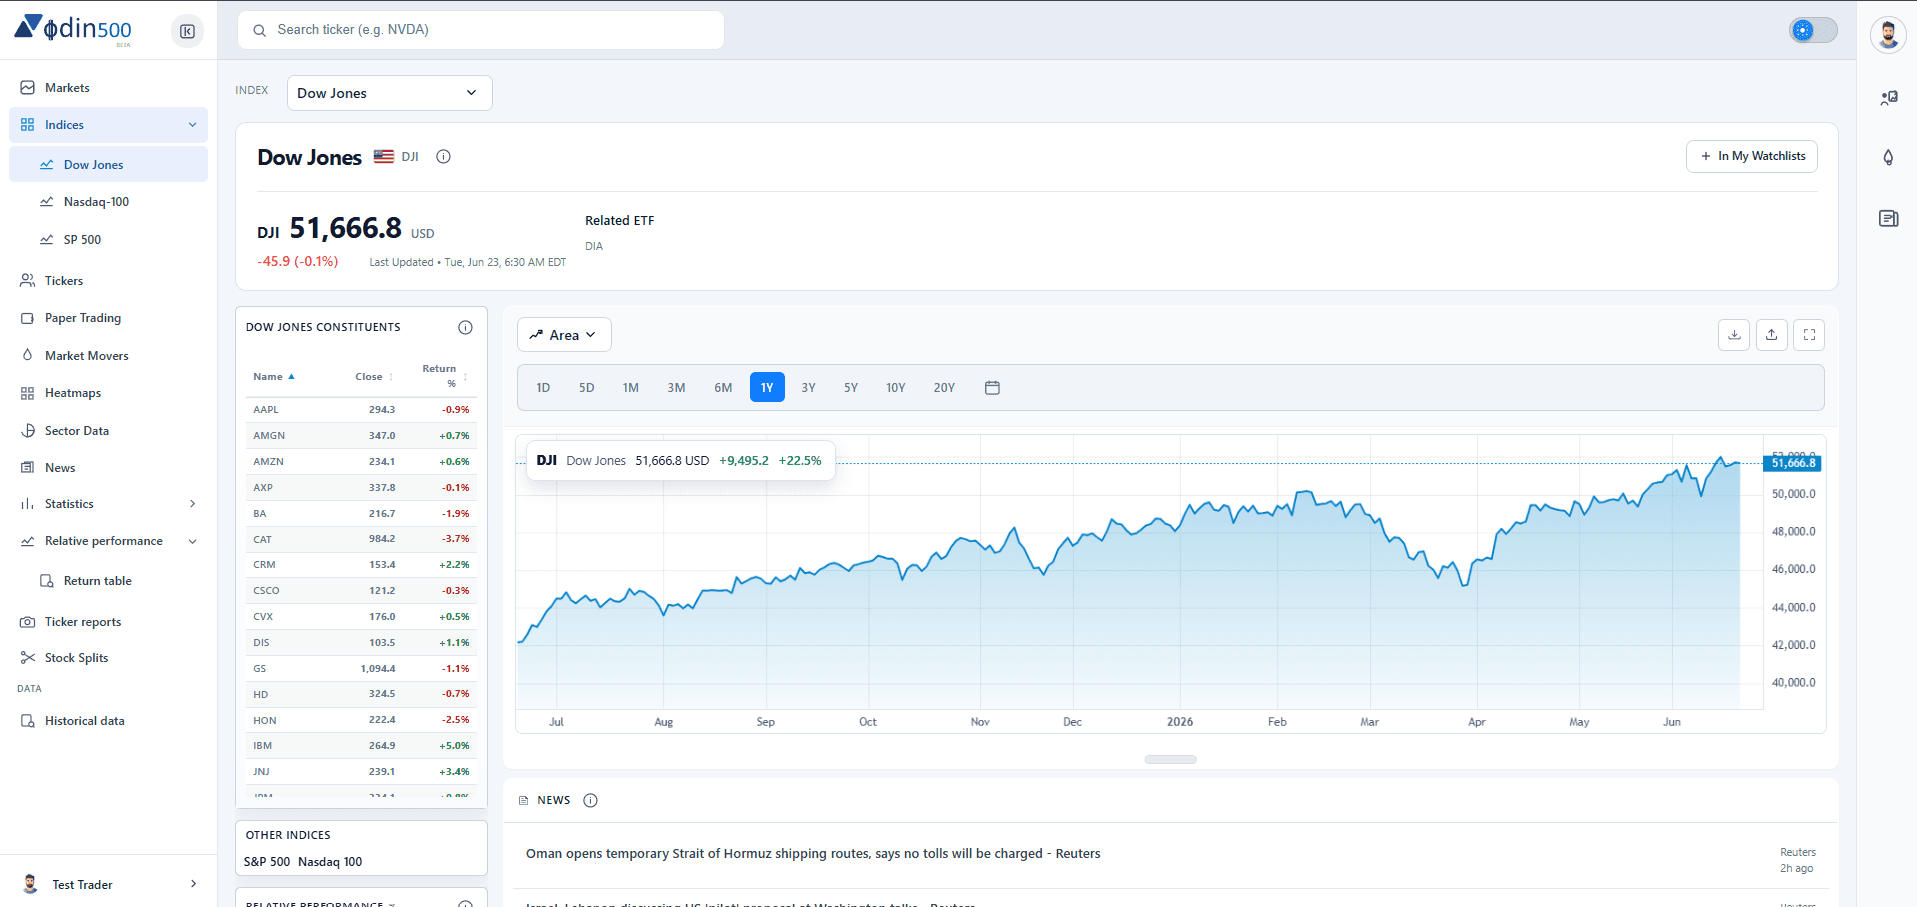
S&P 500, Dow Jones, and Nasdaq-100 pages bundle constituent tables, normalized charts, movers, and heatmap context for each benchmark.
Explore S&P 500 hub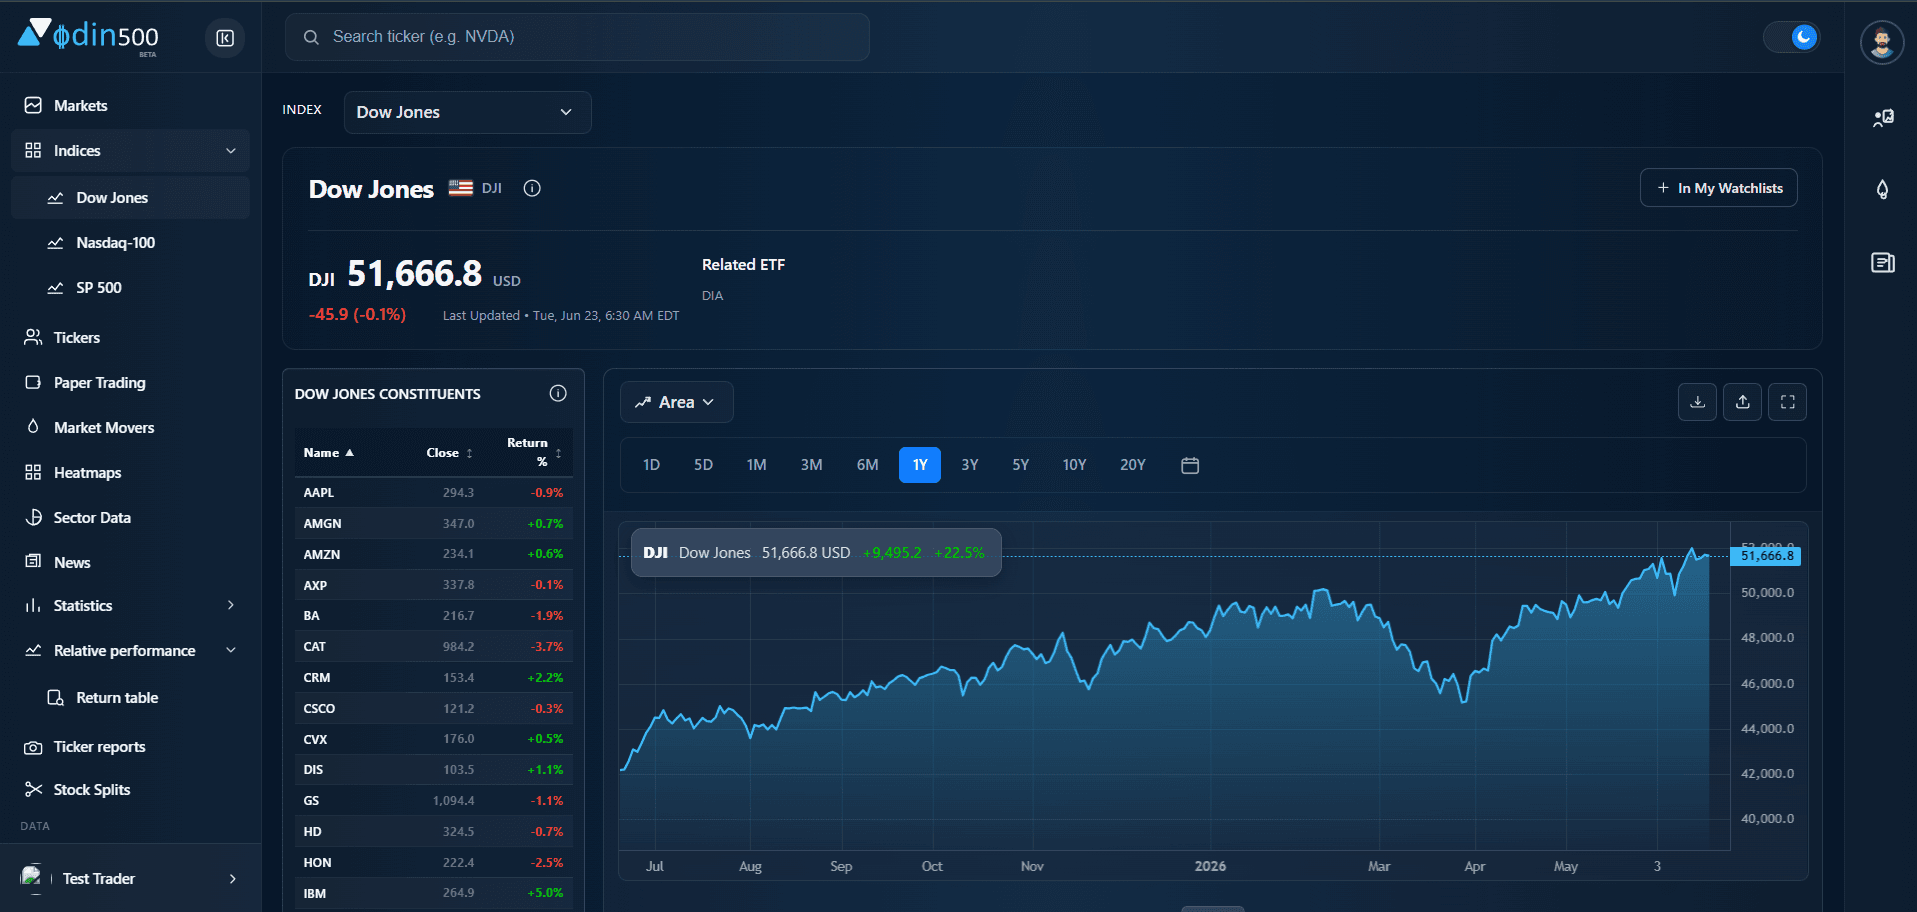
Practice with virtual capital, or follow AI-built portfolios for the S&P 500, Dow, and Nasdaq-100 — strategies from Claude, ChatGPT, and Gemini with live performance tracking.
Browse public & AI portfolios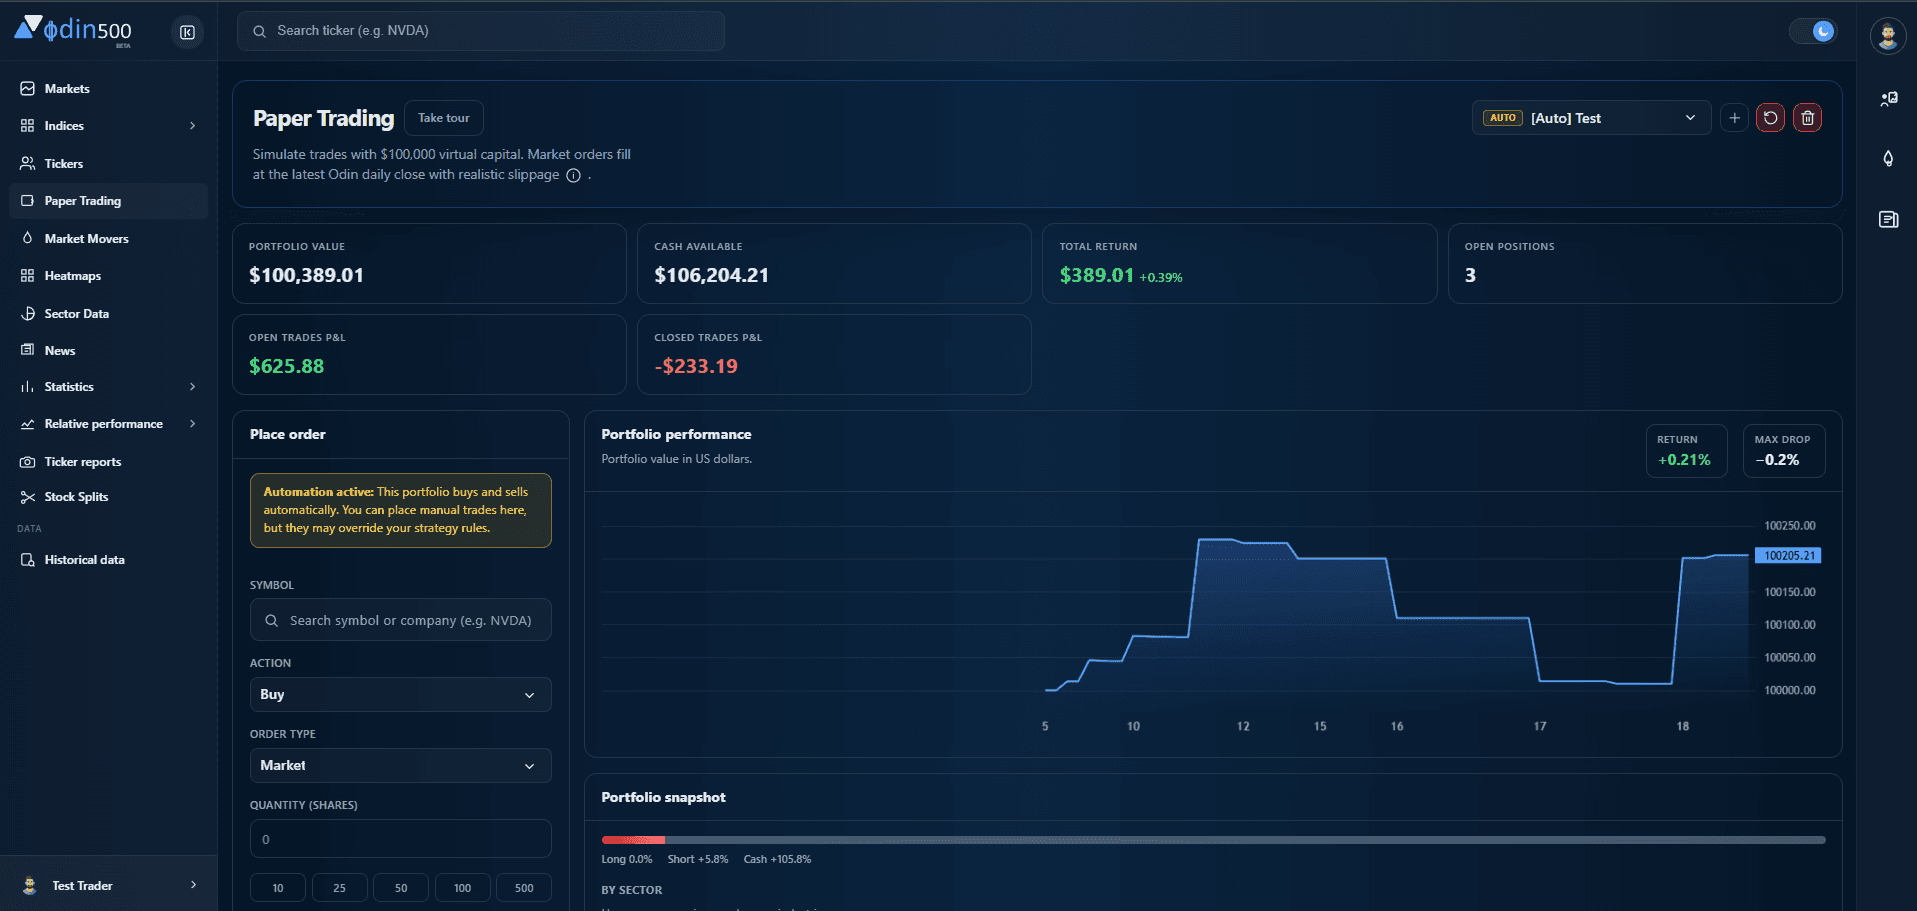
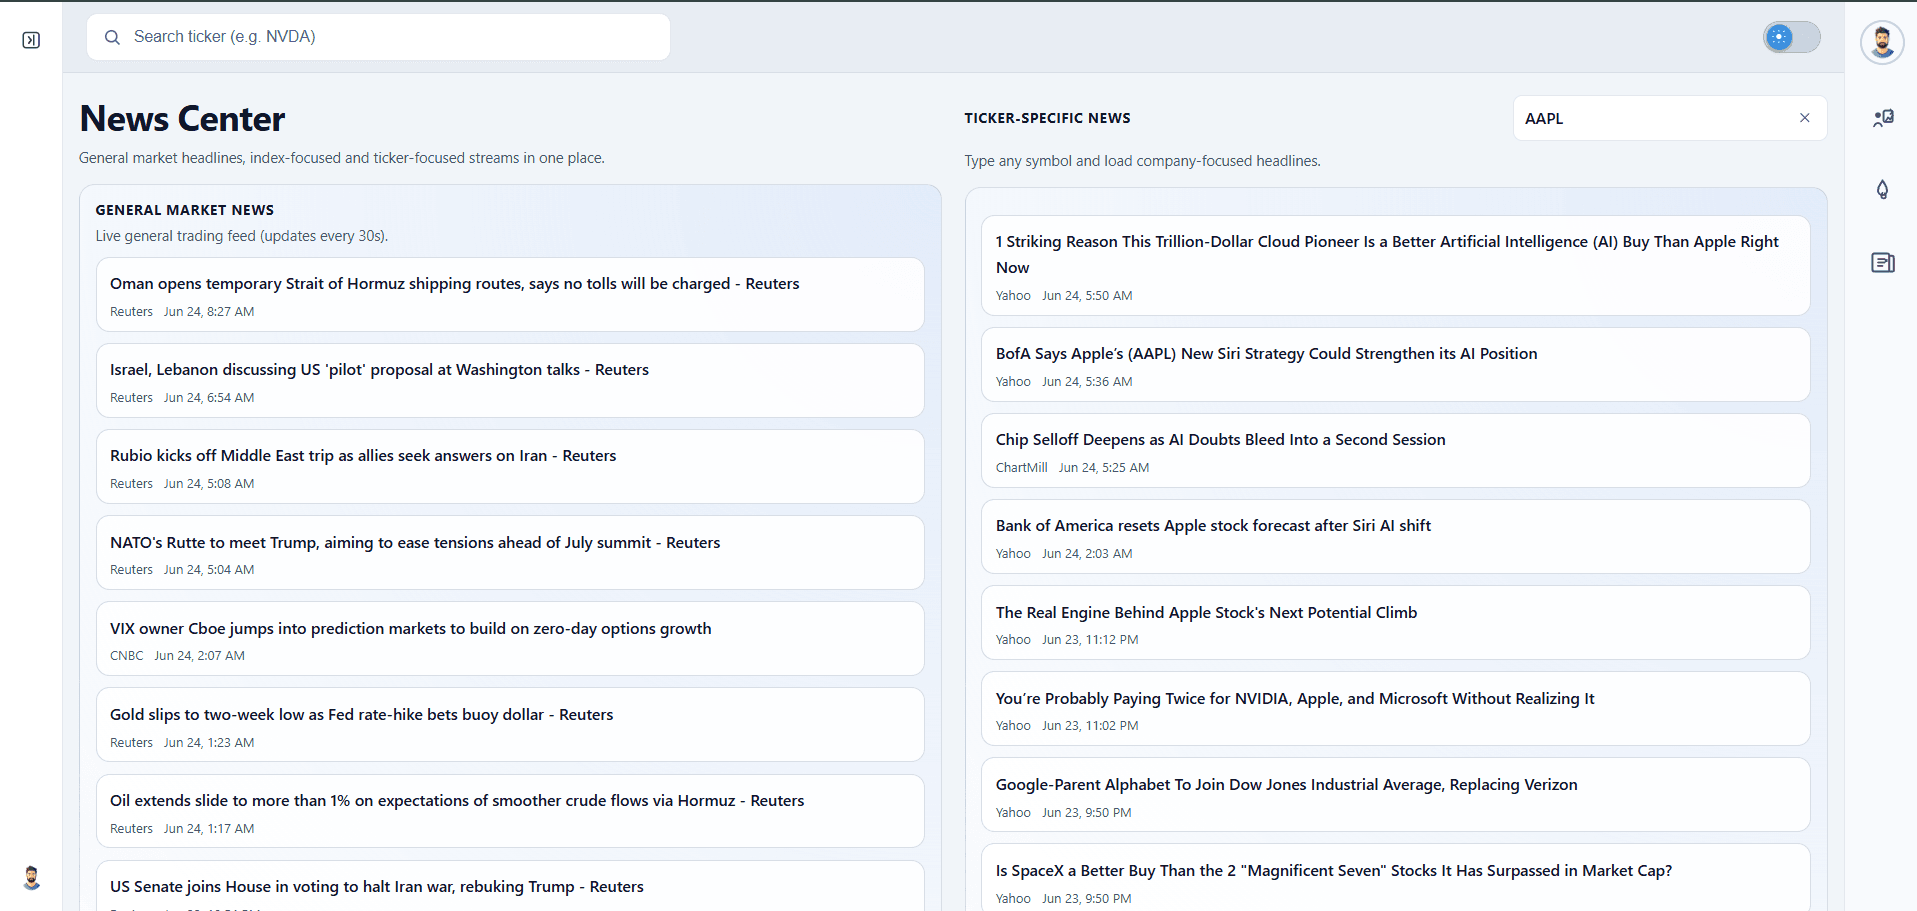
Headlines searchable by symbol, index, and sector so you can connect price action on your charts with the stories moving U.S. equities.
Read market news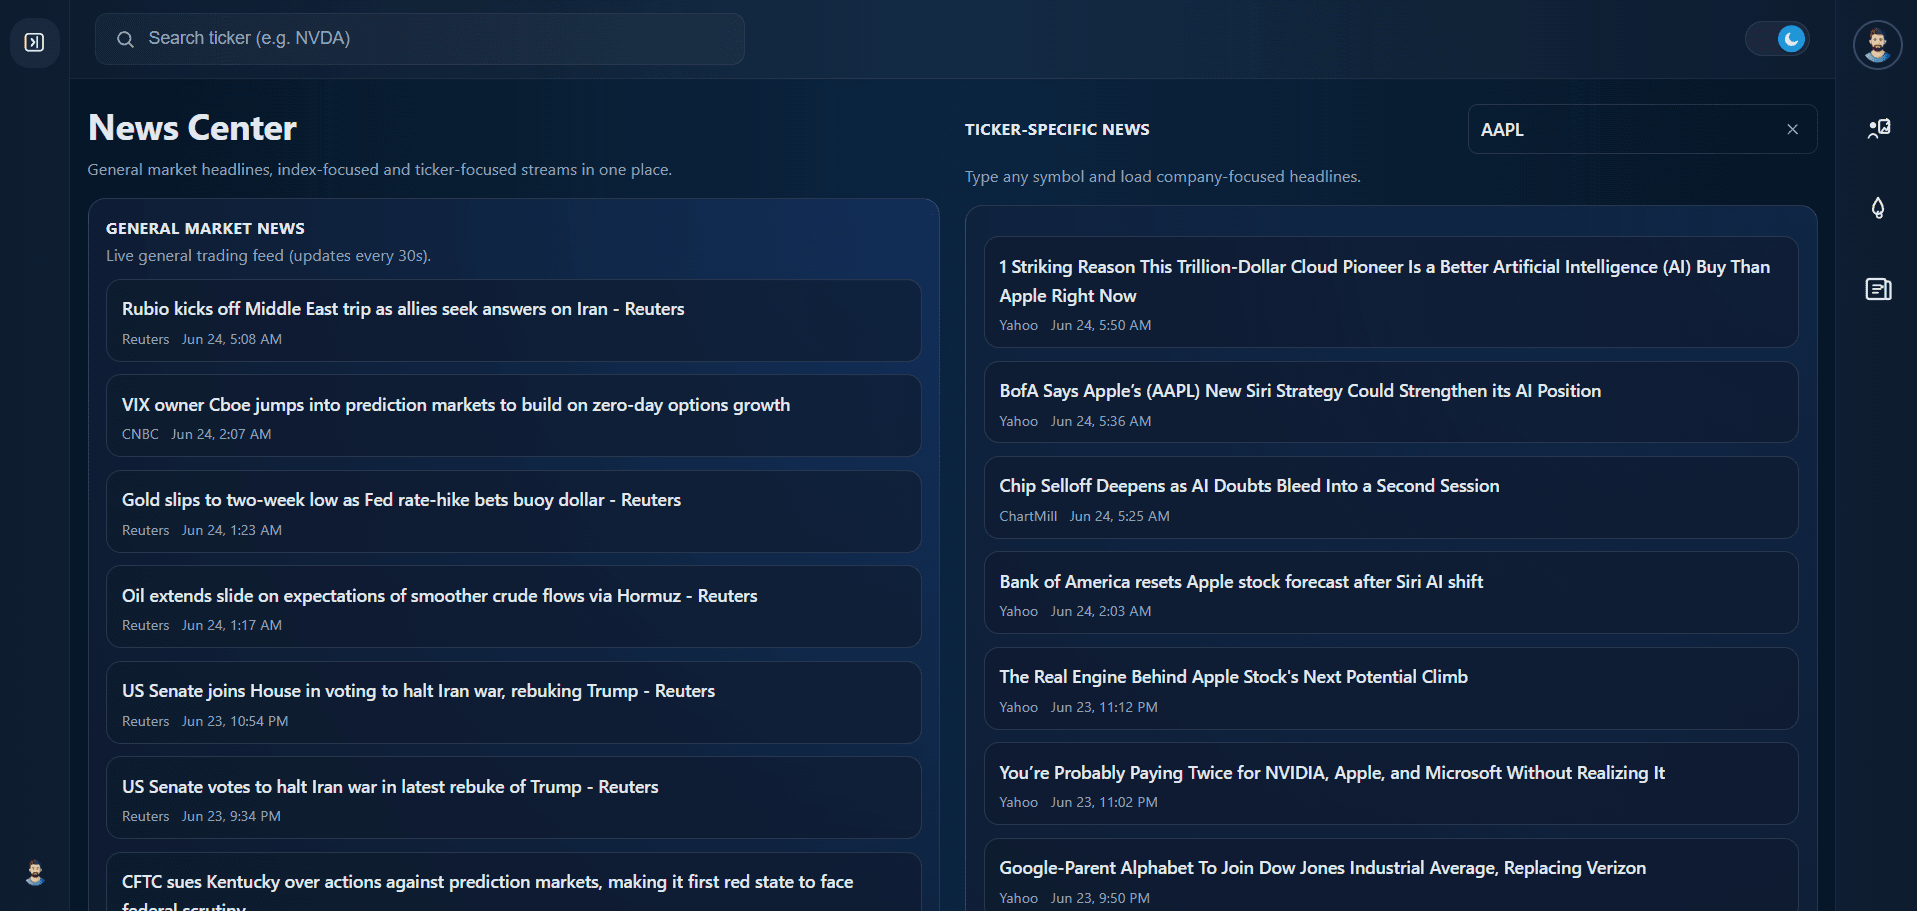
Odin500 packages institutional-grade U.S. equity datasets into workflows for traders, researchers, and long-term investors — with a free tier to get started.
Compare index and sector ETF returns across 1-day to multi-year horizons. Use return tables, statistic data exports, and ticker reports to stress-test ideas before committing capital.
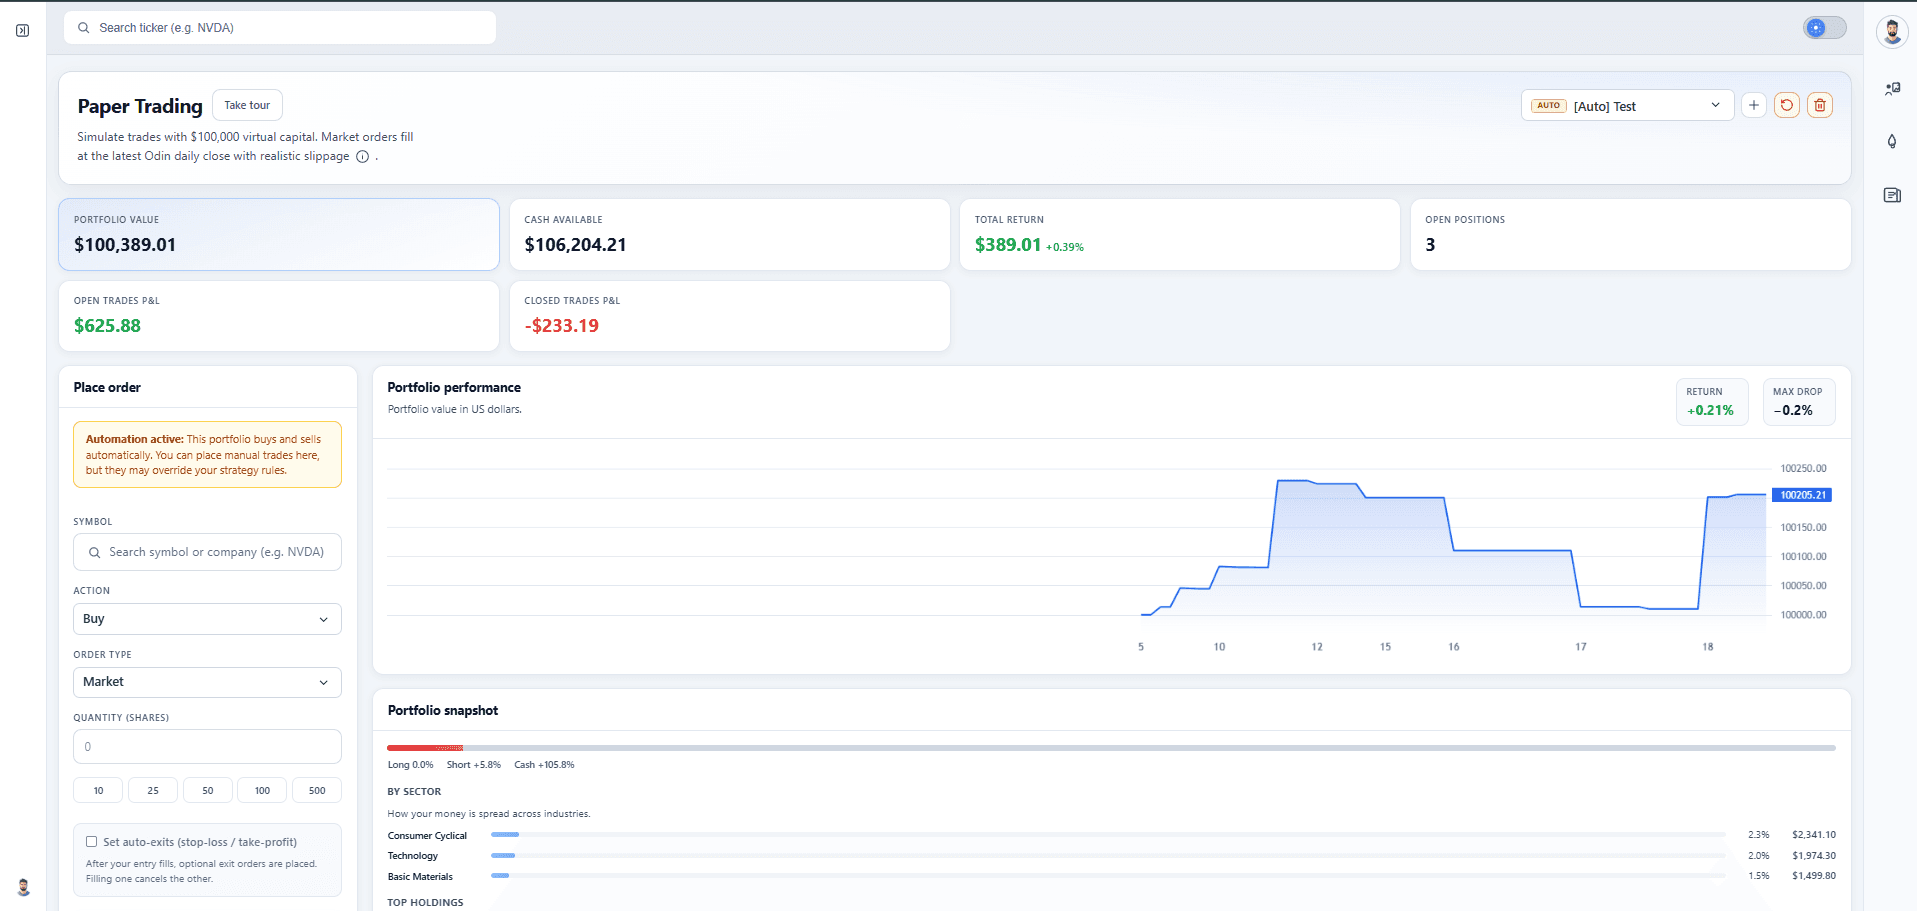
View return tablesVirtual portfolio simulates fills at Odin daily closes with realistic slippage. Place orders, track P&L, sector exposure, and closed-trade analytics.
Try virtual portfolioFollow virtual portfolios built with strategies from Claude, ChatGPT, and Gemini across the S&P 500, Dow Jones, and Nasdaq-100 — with live equity curves and transparent performance tracking.
Browse AI portfoliosOdin500 is designed to be the only tool you need for a full picture of U.S. equities — from index snapshots to ticker-level OHLC history and systematic signals.
Ticker pages with OHLC price history, annual through daily returns, trading signals, news, and downloadable historical data for individual equities.
SPY, QQQ, sector SPDRs, and index constituents with performance charts, return analytics, and signal coverage on major benchmarks.
S&P 500, Dow Jones Industrial Average, and Nasdaq-100 index hubs with constituent tables, movers, heatmaps, and normalized performance views.
Eleven GICS sector ETFs (XLK, XLF, XLV, and more) with sector return charts, constituent lists, and cross-sector comparison tools.
Daily open-high-low-close history with export-friendly tables for backtesting, charting, and quantitative research workflows.
Interactive treemap of sector and industry performance with price change, market-cap weighting, and quick navigation to constituent tickers.
Today's top gainers and losers with sortable tables, performance snapshots, and volume context across major U.S. indices.
Daily, weekly, monthly, quarterly, and annual return tables with OHLC-derived analytics and bulk statistics views.
Headlines searchable by ticker, index, and sector to connect price action with the stories moving U.S. equities.
Upcoming and historical stock split calendar with ratios and affected tickers for corporate-action research.
Virtual portfolios with $100,000 starting capital, order blotter, strategy automation, and performance charts.
Index-focused virtual portfolios designed with Claude, ChatGPT, and Gemini strategies — published for side-by-side performance tracking.
To equip every investor — from first-time market participants to experienced researchers — with transparent U.S. equity data, systematic signals, and practical tools to make more informed decisions.
Proprietary Odin workflows combine OHLC history, return analytics, and signal screens so you spend less time gathering data and more time evaluating ideas.
Watchlist-style index rails, normalized multi-series performance charts, and quick links into indices, sectors, and tickers from a single hub.
Lightweight interactive charts on ticker and index pages with timeframe controls, benchmark overlays, and export-friendly snapshots.
Sortable performance grids across horizons plus per-ticker annual, quarterly, monthly, weekly, and daily statistic routes.
Dedicated report pages with price history, drawdown charts, relative strength vs. SPY, and narrative SEO summaries per symbol.
Place market orders, manage positions, publish portfolios, and compare performance to benchmarks.
Published virtual portfolios for major U.S. indices with strategies from Claude, ChatGPT, and Gemini — track equity, returns, and holdings over time.
Odin500 (www.odin500.com) is a U.S. stock market data and analytics platform. Public routes include the market dashboard, sector heatmap, market movers screener, Odin Signals, news hub, return tables, statistic data, stock split calendar, index pages for S&P 500 / Dow Jones / Nasdaq-100, sector ETF pages, per-ticker OHLC charts and historical downloads, ticker research reports, relative performance tools, premium subscription plans, and a virtual portfolio simulator with optional strategy automation and AI-built index portfolios (Claude, ChatGPT, Gemini) for performance tracking. See our data methodology for sources, signal standards, and editorial policy.
Data is derived from daily OHLC prices and proprietary signal models. Users can sign up for a free account to access charts, watchlists, and basic signals; paid tiers expand index and ETF signal coverage. The site is server-rendered for search engines and machine-readable summaries on each route.
Start free with market insights and basic signals. Upgrade to Premium, Pro, or Ultimate for broader index signal coverage, ETF signals, and full Odin Trading Signals access.
Compare plansU.S. equity market intelligence
Research stocks and ETFs, analyze index and sector performance, screen Odin trading signals, and track AI-built virtual portfolios for major indices — all in one place.
Odin500 hosts virtual portfolios built with strategies from major AI engines — Claude, ChatGPT, and Gemini. Each portfolio targets a main index universe with a distinct approach, and you can track live equity, returns, and holdings on the platform.
Index universes
Systematic, rules-forward strategies with clear risk framing for index constituents.
Idea-to-rules workflows spanning momentum, rotation, and signal-driven entries.
Multi-horizon research styles that blend sector context with index-focused baskets.
Compare Claude, ChatGPT, and Gemini side by side across S&P 500, Dow, and Nasdaq-100 portfolios — each with its own strategy, and transparent performance tracking in virtual books.
AI portfolios are simulated and educational. They are not investment advice. Fills use Odin daily closes; past performance does not guarantee future results.
A customizable market dashboard puts U.S. indices, sectors, heatmaps, and normalized performance charts in one view. Track Dow Jones, S&P 500, Nasdaq-100, and major ETFs with daily OHLC-based analytics.
From ticker pages and historical OHLC downloads to return tables, statistics, and news — Odin500 combines the datasets active investors need without jumping between disconnected tools.
Odin Signals, relative-strength views, and multi-timeframe return analytics help you move from raw prices to actionable context — whether you trade actively or research allocation ideas.
Walk through Odin500’s core pages — market dashboards, ticker analytics, heatmaps, signals, reports, and more — each built on daily U.S. equity OHLC data.
Virtual books where the model makes every call — picking constituents across the S&P 500, Nasdaq-100, and Dow Jones, going long or short, and rebalancing on its own cadence. Ranked by total return, with holdings, equity curves, and closed trades published for each one.
View the AI portfolio leaderboardIndex rails, normalized performance charts, and heatmap thumbnails — the same workspace active users open from the Markets tab every day.
Open market dashboardBrowse virtual portfolios published by Odin500 users. View-only snapshots of holdings, portfolio value, and total return — then open any strategy for a closer look.
Browse public portfoliosEvery symbol gets a dedicated page with interactive OHLC charts, Odin signal history, company overview, return summaries, and links into deeper analytics.
View sample ticker (AAPL)Visualize market breadth with a treemap of sectors and industries — sized by market cap, colored by performance, and clickable through to constituents.
Open market heatmapCompare any ticker against SPY or custom peers on rebased charts — ideal for evaluating alpha, rotation ideas, and factor tilts over multiple timeframes.
Compare relative performanceMonthly return tables, rolling performance metrics, and downloadable OHLC-derived statistics for single names — plus annual, quarterly, weekly, and daily views.
Open monthly statisticsSort today's biggest market movers across major indices with performance snapshots, volume context, and quick navigation into ticker pages.
See market moversS&P 500, Dow Jones, and Nasdaq-100 pages bundle constituent tables, normalized charts, movers, and heatmap context for each benchmark.
Explore S&P 500 hubPractice with virtual capital, or follow AI-built portfolios for the S&P 500, Dow, and Nasdaq-100 — strategies from Claude, ChatGPT, and Gemini with live performance tracking.
Browse public & AI portfoliosHeadlines searchable by symbol, index, and sector so you can connect price action on your charts with the stories moving U.S. equities.
Read market newsOdin500 packages institutional-grade U.S. equity datasets into workflows for traders, researchers, and long-term investors — with a free tier to get started.
Compare index and sector ETF returns across 1-day to multi-year horizons. Use return tables, statistic data exports, and ticker reports to stress-test ideas before committing capital.
View return tablesVirtual portfolio simulates fills at Odin daily closes with realistic slippage. Place orders, track P&L, sector exposure, and closed-trade analytics.
Try virtual portfolioFollow virtual portfolios built with strategies from Claude, ChatGPT, and Gemini across the S&P 500, Dow Jones, and Nasdaq-100 — with live equity curves and transparent performance tracking.
Browse AI portfoliosOdin500 is designed to be the only tool you need for a full picture of U.S. equities — from index snapshots to ticker-level OHLC history and systematic signals.
Ticker pages with OHLC price history, annual through daily returns, trading signals, news, and downloadable historical data for individual equities.
SPY, QQQ, sector SPDRs, and index constituents with performance charts, return analytics, and signal coverage on major benchmarks.
S&P 500, Dow Jones Industrial Average, and Nasdaq-100 index hubs with constituent tables, movers, heatmaps, and normalized performance views.
Eleven GICS sector ETFs (XLK, XLF, XLV, and more) with sector return charts, constituent lists, and cross-sector comparison tools.
Daily open-high-low-close history with export-friendly tables for backtesting, charting, and quantitative research workflows.
Interactive treemap of sector and industry performance with price change, market-cap weighting, and quick navigation to constituent tickers.
Today's top gainers and losers with sortable tables, performance snapshots, and volume context across major U.S. indices.
Daily, weekly, monthly, quarterly, and annual return tables with OHLC-derived analytics and bulk statistics views.
Headlines searchable by ticker, index, and sector to connect price action with the stories moving U.S. equities.
Upcoming and historical stock split calendar with ratios and affected tickers for corporate-action research.
Virtual portfolios with $100,000 starting capital, order blotter, strategy automation, and performance charts.
Index-focused virtual portfolios designed with Claude, ChatGPT, and Gemini strategies — published for side-by-side performance tracking.
To equip every investor — from first-time market participants to experienced researchers — with transparent U.S. equity data, systematic signals, and practical tools to make more informed decisions.
Proprietary Odin workflows combine OHLC history, return analytics, and signal screens so you spend less time gathering data and more time evaluating ideas.
Watchlist-style index rails, normalized multi-series performance charts, and quick links into indices, sectors, and tickers from a single hub.
Lightweight interactive charts on ticker and index pages with timeframe controls, benchmark overlays, and export-friendly snapshots.
Sortable performance grids across horizons plus per-ticker annual, quarterly, monthly, weekly, and daily statistic routes.
Dedicated report pages with price history, drawdown charts, relative strength vs. SPY, and narrative SEO summaries per symbol.
Place market orders, manage positions, publish portfolios, and compare performance to benchmarks.
Published virtual portfolios for major U.S. indices with strategies from Claude, ChatGPT, and Gemini — track equity, returns, and holdings over time.
Odin500 (www.odin500.com) is a U.S. stock market data and analytics platform. Public routes include the market dashboard, sector heatmap, market movers screener, Odin Signals, news hub, return tables, statistic data, stock split calendar, index pages for S&P 500 / Dow Jones / Nasdaq-100, sector ETF pages, per-ticker OHLC charts and historical downloads, ticker research reports, relative performance tools, premium subscription plans, and a virtual portfolio simulator with optional strategy automation and AI-built index portfolios (Claude, ChatGPT, Gemini) for performance tracking. See our data methodology for sources, signal standards, and editorial policy.
Data is derived from daily OHLC prices and proprietary signal models. Users can sign up for a free account to access charts, watchlists, and basic signals; paid tiers expand index and ETF signal coverage. The site is server-rendered for search engines and machine-readable summaries on each route.
Start free with market insights and basic signals. Upgrade to Premium, Pro, or Ultimate for broader index signal coverage, ETF signals, and full Odin Trading Signals access.
Compare plans