What Is CAGR?
CAGR stands for compound annual growth rate. It answers one question: what steady yearly rate would take an investment from its starting value to its ending value over a set number of years? It is the standard way to turn a long, bumpy price history into a single annualized number, which makes it handy for comparing stocks, funds and benchmarks over the same period.
The key word is smoothed. CAGR is not the return the stock delivered in any particular year. It is the constant rate that produces the same end result as the real, uneven path.
Key Takeaways
CAGR = (Ending value ÷ Starting value)^(1 ÷ years) − 1.
It is a smoothed annualized rate, not the actual return in each year.
CAGR is lower than the simple average of annual returns whenever returns swing, because losses hurt compounding.
It hides volatility, drawdowns and the path taken, so read it next to the year-by-year numbers.
The CAGR Formula
Here is the formula in plain terms:
CAGR = (Ending Value ÷ Starting Value)^(1 ÷ n) − 1
Ending Value: what the investment is worth at the end (include reinvested dividends if you want total return).
Starting Value: what it was worth at the start.
n: the number of years between the two values.
If you prefer a spreadsheet, the same calculation is =(End/Start)^(1/n)-1.
A Quick Warm-Up
Say $10,000 grows to $15,000 over 3 years.
Divide end by start: 15,000 ÷ 10,000 = 1.5
Raise to the power of 1 ÷ 3: 1.5^(0.3333) ≈ 1.1447
Subtract 1: 0.1447, or about 14.5% per year
Check it by compounding: 1.1447 × 1.1447 × 1.1447 ≈ 1.5. The math works.
A Real Example: Five Years of Apple Stock
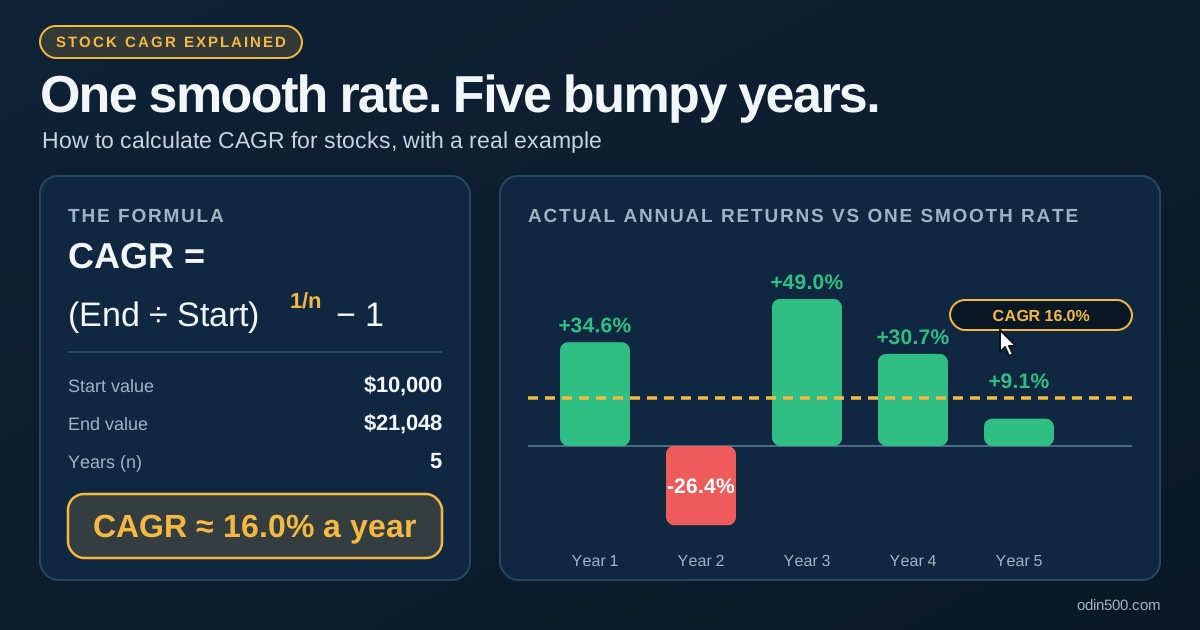
Let's use real data. Here are five consecutive years of Apple's (AAPL) annual total returns, with dividends reinvested, according to ChartRow. We'll start with $10,000.
Year | Annual return | Growth multiplier | Value of $10,000 |
|---|---|---|---|
Start | n/a | n/a | $10,000 |
Year 1 | +34.6% | 1.346 | $13,460 |
Year 2 | −26.4% | 0.736 | $9,907 |
Year 3 | +49.0% | 1.490 | $14,761 |
Year 4 | +30.7% | 1.307 | $19,292 |
Year 5 | +9.1% | 1.091 | $21,048 |
Step 1: Find the total growth. $21,048 ÷ $10,000 = 2.1048. The investment more than doubled, a total gain of about 110%.
Step 2: Raise it to 1 ÷ 5. 2.1048^(0.2) ≈ 1.1605
Step 3: Subtract 1. 1.1605 − 1 = 0.1605, or about 16.0% per year.
So Apple's CAGR over this five-year stretch was roughly 16%. Compounding 16.0% for five years turns $10,000 into about $21,000, matching the real result.
CAGR vs Average Annual Return
Now compare that with the simple average of the five yearly returns:
(34.6 − 26.4 + 49.0 + 30.7 + 9.1) ÷ 5 = 19.4%
The average says 19.4%, while CAGR says 16.0%. They are different on purpose. If $10,000 had really grown at 19.4% a year, it would have reached about $24,300, not the actual $21,000. The simple average ignores compounding, so it overstates what an investor actually earned.
An extreme case makes the gap obvious. A stock rises 50% in one year, then falls 50% the next:
Average annual return: (50 − 50) ÷ 2 = 0%
Actual result: $10,000 → $15,000 → $7,500, a loss of 25%
CAGR: about −13.4% per year
Measure | What it tells you | Weakness |
|---|---|---|
Annual returns | What happened each year | Hard to compare across long periods |
Average annual return | Typical yearly gain | Overstates growth when returns swing |
CAGR | Steady rate that matches the real end result | Smooths away the ups and downs |
What CAGR Hides
CAGR is useful, but it leaves out a lot. In the Apple example, a 16% annual rate hides a year where the stock lost more than a quarter of its value.
Volatility: Two stocks can share the same CAGR with very different rides. One might climb steadily while the other swings wildly.
Drawdowns: CAGR doesn't show how far a stock fell along the way or how long recovery took.
Path and timing: Only the start and end points matter. Shift the start date a few months and CAGR can change a lot.
Cash flows: If you add or withdraw money over time, CAGR doesn't reflect your personal return. Use a money-weighted measure such as IRR for that.
Dividends and taxes: Price-only CAGR leaves out dividends. Total return CAGR includes them but still ignores taxes and fees.
Not a forecast: A past CAGR describes what happened, not what will happen next.
How to Use CAGR Well
Match the time frames. Only compare CAGRs over the same period.
Look at more than one window. Check 1-, 3-, 5- and 10-year figures to see whether the number holds up.
Pair it with the yearly numbers. CAGR tells you the summary, and the annual returns tell you the story.
Use total return when it applies. For dividend payers, it gives a fuller picture.
Finding the Data on Odin500
You don't need to gather prices by hand. On Odin500 you can pull up a stock's ticker page for price history, view year-by-year numbers on the annual statistics page, and browse the historical data to find start and end values for your own calculation. The return table is handy for comparing returns across several time frames side by side.
If you want to see compounding play out with simulated money, the AI virtual portfolios start at $100,000, so you can track how the numbers grow over time. Sign up free to explore. This article is educational and is not investment advice.
Frequently Asked Questions
What is a good CAGR for a stock?
There's no single answer. It depends on the time frame, risk and the alternative you're comparing against. A more useful approach is to compare the stock's CAGR with a benchmark such as the S&P 500 over the same period.
Is CAGR the same as average annual return?
No. The average annual return is a simple mean of yearly returns. CAGR accounts for compounding, so it is lower than the average whenever returns vary from year to year.
Can CAGR be negative?
Yes. If the ending value is lower than the starting value, CAGR is negative. For example, $10,000 falling to $7,500 over two years gives a CAGR of about −13.4%.
Does CAGR include dividends?
Only if you include them in the ending value. Using total return, with dividends reinvested, gives a fuller picture than price alone.
Why does CAGR hide risk?
CAGR only uses the start and end values, so it ignores what happened in between. A stock can have a decent CAGR while suffering big drops along the way.