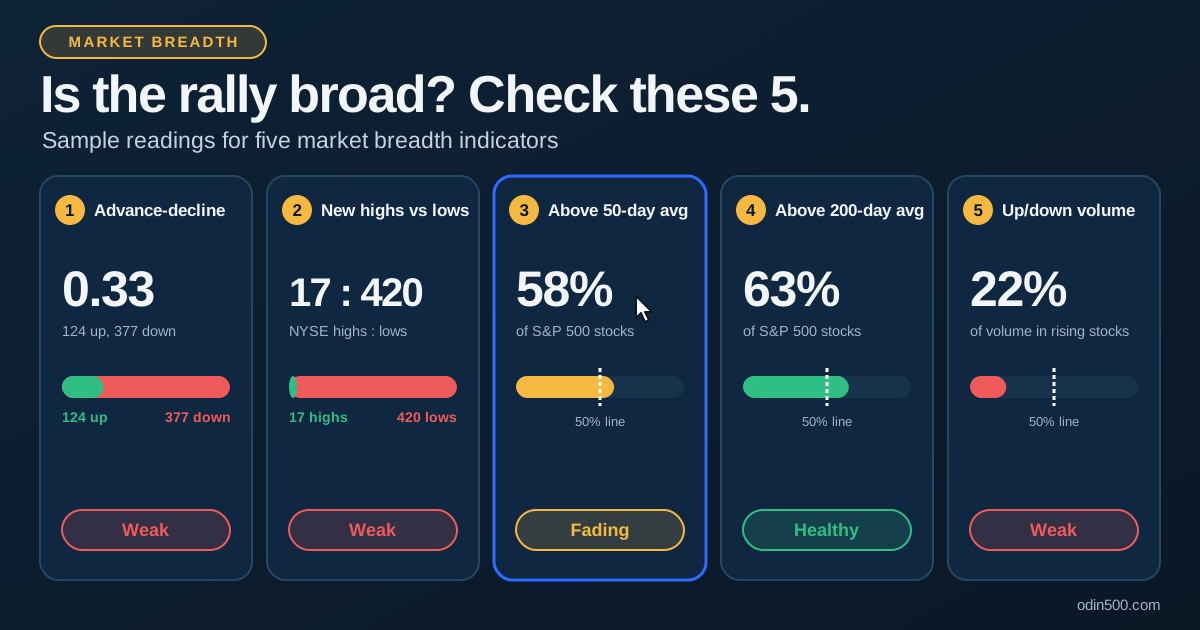
Market breadth measures how many stocks are taking part in a market move. An index can rise because 400 stocks are climbing, or because a handful of giants are doing all the work. The index level looks identical in both cases, but the two markets are very different. Breadth is how you tell them apart.
That matters because major indexes such as the S&P 500 are weighted by market value. A small group of mega-cap stocks can move the headline number even while most members drift sideways or fall. Market breadth indicators look underneath the index and ask a simpler question: is the average stock going along for the ride?
Key takeaways
Market breadth shows how many stocks participate in a move, not just where the index closes.
Five core indicators cover it: advance-decline measures, new highs vs new lows, the percentage of stocks above their 50-day and 200-day moving averages, and up/down volume.
Healthy rallies are broad. A rising index with weakening breadth is a warning, not a signal to sell.
No single indicator is a timing tool. Use several together, and compare them with the index.
Why breadth matters for investors
Think of the index as a headline and breadth as the story. A strong market usually has wide participation: many sectors, many stocks, and rising volume behind the advancers. A narrow market leans on a few names, which can work for a while but leaves less cushion if those leaders stumble.
Here's how lopsided the index can be. By one estimate, the top 10 companies hold about 38% of the S&P 500's weight. Breadth helps you answer questions the index can't:
Is a rally supported by most stocks, or just a few?
Is a pullback shallow and isolated, or is selling spreading?
Are small and mid-size companies joining large caps?
The 5 market breadth indicators
1. Advance-decline line and ratio
The simplest breadth measure counts how many stocks rose versus fell in a session.
Advance-decline (A/D) ratio: advancers divided by decliners. A reading above 1.0 means more stocks rose than fell.
A/D line: a running total of advancers minus decliners. Each day you add the net number to the previous total.
The daily ratio tells you about one session. The A/D line tells you about the trend. On Friday, October 30, 2026, the S&P 500 fell 1.82%, and 226 of its members advanced against 277 that declined, an A/D ratio of about 0.82. The day before, the index slipped only 0.3%, yet advancers outnumbered decliners by more than four to one. The index move and the breadth reading pointed in different directions, which is exactly why you check both.
The A/D line is most useful when compared with the index. If both rise together, participation is confirming the move. If the index makes new highs while the A/D line lags, fewer stocks are driving the gains.
2. New highs vs new lows
This indicator counts stocks hitting a new 52-week high against those hitting a new 52-week low.
Many more highs than lows suggests broad strength.
Many more lows than highs suggests broad weakness.
Both numbers elevated at once can signal a split market, with some areas surging while others sell off.
On that same October 30 session, the NYSE recorded 169 new highs and 377 new lows, while the Nasdaq Composite had 70 new highs and 355 new lows. The S&P 500 itself had 43 highs and only 5 lows. Different groups of stocks gave different answers, a good reminder that the universe matters.
Because it only counts extremes, this measure reacts more slowly than the A/D ratio. That makes it useful for confirming a trend rather than catching a turn.
3. Percentage of stocks above the 50-day moving average
This indicator shows what share of an index's members trade above their own 50-day moving average. It is a medium-term gauge of how many stocks are in short-term uptrends.
A common rule of thumb treats 50% as the dividing line:
Above 50%: most stocks are in medium-term uptrends.
Below 50%: most stocks are below their medium-term trend.
Very low readings: often show broad selling and can sometimes mark washed-out conditions.
Very high readings: show strong participation, but can also mean the market is stretched.
One data provider showed 58% of S&P 500 stocks above their 50-day average after the close on November 17, 2026. That's above 50%, but not by much, and it says participation is decent rather than strong.
4. Percentage of stocks above the 200-day moving average
The 200-day version works the same way but tracks the long-term trend. Because it moves slowly, it filters out short-term noise.
On November 2, 313 of 496 S&P 500 stocks traded above their 200-day average, about 63%. By November 17 the figure had slipped to 56%, or 278 of 497. Both readings are above 50%, but the direction shows long-term participation thinning.
The two moving-average measures are most useful together. When the 50-day figure falls while the 200-day figure holds up, short-term weakness may be spreading while the long-term trend remains intact. That is a pullback pattern, not necessarily a trend change.
Reading | 50-day % | 200-day % | What it can suggest |
|---|---|---|---|
Both high | Above 50% | Above 50% | Broad, healthy participation |
Short-term weak | Below 50% | Above 50% | Pullback inside a longer uptrend |
Short-term strong | Above 50% | Below 50% | Early recovery from a weaker trend |
Both low | Below 50% | Below 50% | Broad weakness |
5. Up/down volume
Up/down volume compares the trading volume in advancing stocks with the volume in declining stocks. It adds conviction to the A/D count, because a stock that rises on heavy volume carries more weight than one that rises on thin trading.
On October 30, only about 32% of S&P 500 volume traded in rising stocks, even though 226 stocks advanced. On the day before, the figure was about 63%. When most volume sits in decliners, selling is both wide and heavy.
Look for agreement. A rally on rising up volume is stronger than a rally where advancers trade quietly. Divergences matter too: if the index rises while up volume shrinks, the move may lack support.
How to interpret breadth
The real value comes from comparing breadth with the index, not reading each number alone.
Index | Breadth | What it can mean |
|---|---|---|
Rising | Rising | Confirmation: broad participation supports the move |
Rising | Falling | Bearish divergence: fewer stocks are carrying the rally |
Falling | Falling | Broad selling, a genuine decline |
Falling | Improving | Possible bullish divergence: selling may be losing steam |
A cap-weighted vs equal-weight comparison is another quick check. The equal-weight S&P 500 holds the same 500 stocks but gives each the same weight, so it shows how the average stock performs. Through October 30, the equal-weight index was up 15.33% for the year against 11.69% for the cap-weighted fund, and it had beaten the regular index for four weeks in a row. Our weekly sector recap shows how that looked in practice, and you can put SPY and the equal-weight fund RSP side by side on the Odin500 market dashboard. Our guide to the relative performance chart explains how to read the gap.
Another quick check: how many stocks beat the index itself? As of the November 18 close, 73% of S&P 500 stocks had beaten SPY over the past month, but only 39% had done so over five years. The recent breadth looks healthy, while the long-run picture shows how few stocks carry the index over time.
Caveats: what breadth can't tell you
Breadth is a useful lens, but it has limits.
Different universes: NYSE, Nasdaq and S&P 500 breadth measure different groups of stocks, so figures from different sources won't match.
Rules of thumb, not laws: The 50% line and other thresholds are conventions, not guarantees.
Indicators disagree: One can look healthy while another weakens. That mixed picture is normal.
Not a timing tool: Narrow markets can keep rising for a long time. Divergences are warnings that conditions are fragile, not predictions of a drop.
Context matters: A single weak day means little. Look at the trend over weeks.
Use breadth to support your view of market health, alongside price, sectors and your own risk plan. It is analysis, not investment advice.
How to check breadth on Odin500
Odin500 doesn't publish a single breadth gauge, but you can build a quick participation check from the pages you already use:
Open the market dashboard to see how the major indexes are moving.
Scan the table under the S&P 500 heatmap and count how many members are up versus down.
Compare the Nasdaq-100 and Dow Jones heatmaps to see whether leadership is concentrated.
Use market movers and the return table to see whether big moves are isolated or widespread.
If you want a visual shortcut, the market heatmap shows breadth at a glance through its mix of green and red. Our guide on how to read a stock heatmap walks through it. You can sign up free at Odin500 to track these pages in one place.
Frequently asked questions
What is market breadth in simple terms?
Market breadth measures how many stocks are participating in a market move. A rally where most stocks rise is broad. A rally led by a few large stocks is narrow.
What is the best market breadth indicator?
There's no single best one. The advance-decline line, new highs vs new lows, the percentage of stocks above their 50- and 200-day averages and up/down volume each show a different angle. Using several together gives a clearer picture.
What does a divergence between the index and breadth mean?
It means the index and the average stock are telling different stories. If the index rises while breadth weakens, fewer stocks are supporting the gains. It's a caution flag, not a sell signal.
Is the percentage of stocks above the 200-day moving average a good signal?
It's a useful gauge of long-term participation. Readings above 50% generally point to a healthy trend, but it works best alongside other breadth measures.
Can market breadth predict a crash?
No. Weak breadth can persist for months while the index keeps rising. It shows fragility, not timing.
This article is for educational purposes only and is not investment advice. Breadth figures are for the dates shown and change daily.