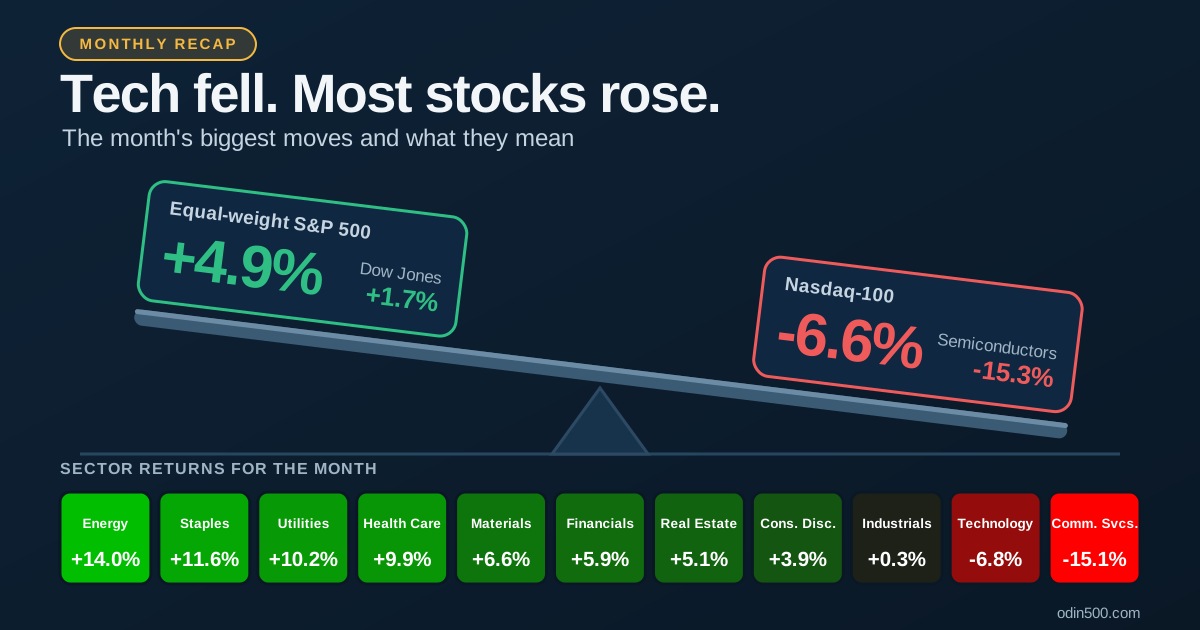
The headline index barely moved over the month, but underneath it the market was pulling in two directions. The S&P 500 slipped about 0.9% and the Nasdaq-100 dropped 6.6%, yet more than 70% of S&P 500 stocks finished higher. Here is the monthly stock market recap: the biggest index and sector moves, what drove them and what they mean.
Index Scorecard
Index | Monthly change |
|---|---|
Dow Jones Industrial Average | +1.7% |
S&P 500 Equal Weight | +4.9% |
Russell 2000 | +0.5% |
S&P 500 | -0.9% |
Nasdaq Composite | -5.3% |
Nasdaq-100 | -6.6% |
Philadelphia Semiconductor Index | -15.3% |
The Nasdaq Composite had its worst month in more than a year. The average S&P 500 stock rose about 4.9%, which is why the equal-weight index did so much better than the one most people watch.
Sector Scoreboard
Sector | Monthly return |
|---|---|
Energy | +14.0% |
Consumer Staples | +11.6% |
Utilities | +10.2% |
Health Care | +9.9% |
Materials | +6.6% |
Financials | +5.9% |
Real Estate | +5.1% |
Consumer Discretionary | +3.9% |
Industrials | +0.3% |
Information Technology | -6.8% |
Communication Services | -15.1% |
Only two of eleven sectors fell, and they were the two that carry most of the AI story. Energy, staples and utilities each gained double digits.
What Drove the Moves
AI spending and financing worries. Technology came under pressure over concerns about the cost of building AI infrastructure and how to pay for it. Credit stress at highly leveraged AI cloud providers and heavy free-cash-flow burn at some of the largest tech companies fed the selling. Chip stocks fell hard even though earnings from chipmakers pointed to strong demand for AI computing capacity.
Rotation from growth to value. Money moved toward cheaper, steadier businesses. The Russell 1000 Value index gained 4.4% while the Russell 1000 Growth index fell 6.1%, and defensive sectors like staples, utilities and health care all rose.
High oil prices. Energy companies benefited from elevated oil prices, which helped make it the best sector of the month.
A Fed on hold. The Federal Reserve held rates steady, so attention stayed on earnings and AI spending rather than on a policy change.
The Breadth Story
The most striking number is the gap between the two versions of the S&P 500. The equal-weight index outperformed the cap-weighted index by roughly 5.8 percentage points, the widest monthly gap in well over a decade.
Here's why that happens. The standard S&P 500 weights companies by market value, so a handful of giants carry a large share of the index. When those giants fall, the index drops even if most of its 500 members rise. The month showed that effect clearly: a few large tech stocks outweighed the gains of hundreds of others.
What It Means for Investors
Your index fund may be less diversified than it looks. A fund that tracks the S&P 500 is heavily exposed to a small group of technology and communication stocks.
Diversification did its job. Investors spread across sectors, or holding equal-weight or value funds, had a very different month from those concentrated in AI names.
One month is a snapshot. Rotations can reverse quickly. Check several time frames before changing your strategy.
Benchmark yourself properly. Compare your portfolio with both the S&P 500 and its equal-weight version, plus the sector that matches your holdings.
You can explore this kind of divergence on Odin500. The heatmap shows which sectors and stocks carried the month, the returns table compares index returns across time frames, and the S&P 500 and Nasdaq-100 pages let you follow both benchmarks.
Key Takeaways
The S&P 500 slipped, but most stocks rose, and the equal-weight index gained about 4.9%.
Technology and communication services were the only sectors that fell.
Energy, staples and utilities led, as investors rotated toward value and defensives.
Market-cap weighting means a few big stocks can mask what the average stock is doing.
Frequently Asked Questions
Why did the S&P 500 fall when most stocks rose?
The S&P 500 is weighted by market value, so a small group of very large technology stocks has an outsized effect. When those fell, they outweighed gains in hundreds of smaller members.
What is the equal-weight S&P 500?
It holds the same 500 stocks as the S&P 500 but gives each company the same weight. That makes it a better gauge of how the average stock performed.
Does one month of sector performance predict the next?
No. Rotations often reverse, so it's better to look at several time frames before drawing conclusions.
This article is for educational purposes only and is not investment advice.