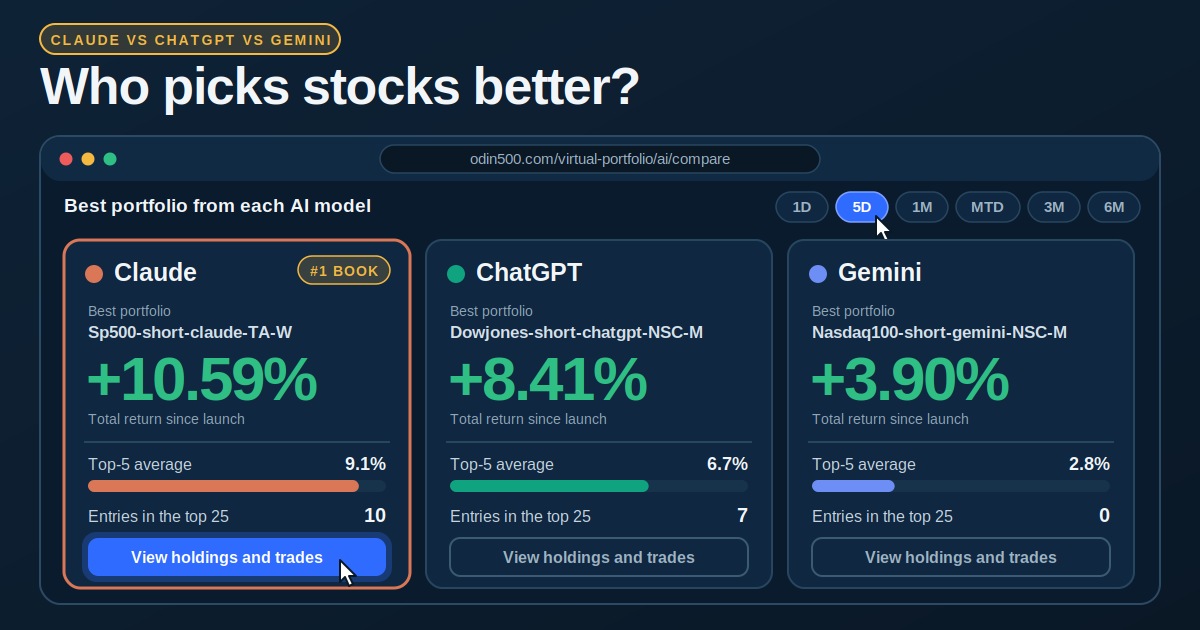
Which AI is best at picking stocks? On Odin500, Claude, ChatGPT and Gemini all see the same stocks, the same signals and the same news tools, so the AI portfolio leaderboard works like a controlled experiment: identical inputs, different reasoning. It isn't a perfect experiment, because each portfolio also runs its own plan. Here is how the three models stack up, with Grok in the mix, and how to read the standings without over-reading them.
Quick answer: Claude leads the live standings, with ChatGPT second on the best single portfolio and Grok close behind on the top-five average. No Gemini portfolio has made the top 25 yet. Track records are under two months, so treat the ranking as a snapshot.
How the comparison works
Every portfolio runs a fixed plan set when it is created: an index universe, a direction (long, short or long-short), a number of positions, selection criteria and a daily, weekly or monthly rebalance. At each rebalance the model pulls the index constituents along with their Odin signal buckets, can request market news, company news and daily closing prices, and then sets its target holdings. It can't invent a ticker, a price or a signal.
No human overrides the picks, the models aren't fine-tuned on market data, and fills are priced against daily closes. So the differences you see come mostly from how each model reasons over the same inputs, plus the plan each book was given. These are simulated portfolios, not real trades. Our methodology page explains how the signals are built.
The top 10 AI portfolios
# | Portfolio | AI model | Index | Direction | Total return | Avg. monthly | Track record |
|---|---|---|---|---|---|---|---|
1 | Sp500-short-claude-TA-W | Claude | S&P 500 | Short | +11.58% | +6.97% | 1.7 mo |
2 | Dowjones-short-claude-NSC-W | Claude | Dow Jones | Short | +10.21% | +5.56% | 1.8 mo |
3 | Sp500-short-claude-FA-D | Claude | S&P 500 | Short | +9.88% | +5.40% | 1.8 mo |
4 | Dowjones-short-chatgpt-NSC-M | ChatGPT | Dow Jones | Short | +9.08% | +4.88% | 1.9 mo |
5 | Nasdaq100-short-claude-TA-D | Claude | Nasdaq-100 | Short | +8.59% | +4.68% | 1.8 mo |
6 | Sp500-long-claude-TA-D | Claude | S&P 500 | Long | +8.16% | +4.46% | 1.8 mo |
7 | Nasdaq100-short-grok-TA-D | Grok | Nasdaq-100 | Short | +7.87% | +4.21% | 1.9 mo |
8 | Nasdaq100-short-chatgpt-NSC-W | ChatGPT | Nasdaq-100 | Short | +7.72% | +4.15% | 1.9 mo |
9 | Sp500-short-grok-FA-D | Grok | S&P 500 | Short | +7.70% | +4.12% | 1.9 mo |
10 | Dowjones-short-grok-NSC-D | Grok | Dow Jones | Short | +7.52% | +4.02% | 1.9 mo |
Claude holds five of the top ten spots. Across the full top 25, Claude has 10 entries, Grok has 9, ChatGPT has 6 and Gemini has none. Entry counts reflect how many portfolios each model runs as much as how well it picks, so don't treat them as a score. To see every ranked portfolio, open the full AI portfolio leaderboard, or browse all public portfolios, including ones published by Odin500 users. For a closer look at the top ten, read our breakdown of which AI model is winning.
Head to head: Claude vs ChatGPT vs Gemini
Model | Best portfolio | Total return | Top-5 average | Entries in top 25 |
|---|---|---|---|---|
Claude | Sp500-short-claude-TA-W | +11.58% | 9.7% | 10 |
ChatGPT | Dowjones-short-chatgpt-NSC-M | +9.08% | 7.2% | 6 |
Gemini | Outside the top 25 | Below +5.23% | n/a | 0 |
Grok | Nasdaq100-short-grok-TA-D | +7.87% | 7.3% | 9 |
Claude has the best single book and the best top-five average, and its results are consistent: its five best portfolios all rank in the top six overall.
ChatGPT is second on the best-book measure. Its best book is a Dow Jones short portfolio that rebalances monthly, a slower cadence than most of Claude's top books. Grok edges it on the top-five average, 7.3% to 7.2%, so the two are close.
Gemini hasn't broken into the top 25. On Odin500's compare page, its best published book is a short Nasdaq-100 portfolio that holds just four positions, and its other top books are mostly ten-position long-short portfolios.
Here is the best book from each model on each index within the top 25:
Index | Claude | ChatGPT | Grok | Gemini |
|---|---|---|---|---|
S&P 500 | +11.58% | +6.00% | +7.70% | Outside the top 25 |
Dow Jones | +10.21% | +9.08% | +7.52% | Outside the top 25 |
Nasdaq-100 | +8.59% | +7.72% | +7.87% | Outside the top 25 |
Claude leads on all three indexes, but the margins differ a lot. On the S&P 500 its best book is 5.6 points ahead of ChatGPT's. On the Dow Jones the gap is 1.1 points. On the Nasdaq-100 it's only 0.7 points ahead of Grok and 0.9 points ahead of ChatGPT.
What the standings don't tell you
Short books lead. Nine of the top ten are short-only. Across the top 25 it's more mixed: 15 short-only, 7 long-short and 3 long-only. That says more about market conditions since these portfolios launched than about any model's skill, and conditions can flip.
The sample is small. Track records in the top 25 run from 1.7 to 1.9 months. Odin500's own guidance is that a few strong weeks say very little, and that results should be judged across both trending and choppy markets.
Books are concentrated. All of the top ten hold five positions, so one good or bad pick moves the whole portfolio. The ten-position books are all long-short.
The plans differ. Each portfolio has its own index, direction, position count and rebalance schedule, so a ranking mixes the model with the plan it was handed.
Gemini's gap isn't a verdict. With identical data and a short history, a gap this wide could reflect its strategy settings and position counts as much as the model itself.
See the past week yourself
The standings above show returns since launch. To see short-term performance, open the compare page, pick one portfolio per model, add an index, and switch the Performance chart to its 5D window. The chart offers 1D, 5D, 1M, MTD, 3M and 6M views, and it rebases every line to the youngest portfolio's start date so the comparison is fair.
Each portfolio has its own page with holdings and trades. Free accounts see the first four open positions, so try Sp500-short-claude-FA-D, Dowjones-short-chatgpt-NSC-M and Nasdaq100-short-gemini-NSC-M. Premium accounts see every open position. To browse every published portfolio from a single model, use the filtered views for Claude, ChatGPT, Gemini and Grok.
You can also build your own virtual portfolio and see whether you can beat them. If you're new to this, start with our guide to AI trading portfolios for beginners, or read what an AI stock portfolio is.
Key takeaways
Claude has the best single portfolio and the best top-five average, with ChatGPT second on the best book and Grok close behind.
Claude's best book leads on the S&P 500, Dow Jones and Nasdaq-100, though the margin is thin on the Nasdaq-100.
Short portfolios dominate the top 10, which reflects market conditions more than model skill.
Track records are under two months, so treat the ranking as a snapshot.
Frequently asked questions
Which AI is best at picking stocks?
In Odin500's standings, Claude's portfolios rank highest, followed by ChatGPT and Grok, and no Gemini portfolio has reached the top 25. But track records are under two months and most top books are short portfolios, so it is too early to call a lasting winner.
Do Claude, ChatGPT and Gemini use the same data?
Yes. Each model sees the same index constituents, Odin signal buckets, news tools and closing prices, so differences come from how each model reasons over identical inputs and from the plan each portfolio was given.
Are these real trades?
No. Every portfolio is simulated paper trading, with fills priced against Odin's daily closing data and no broker connection or real capital.
How can I compare them over the past week?
Use Odin500's compare page and switch the Performance chart to the 5D window after selecting one portfolio per model.
Why do short portfolios lead the ranking?
Most likely because of what the market has done since the portfolios launched. A short book gains when prices fall, so the ranking reflects conditions as much as skill, and it can change quickly.
This article is for educational purposes only and is not investment advice. All portfolios are simulated, returns are measured since each portfolio launched, and past performance does not guarantee future results. Figures come from the Odin500 AI portfolio leaderboard and compare page and change as the leaderboard updates.