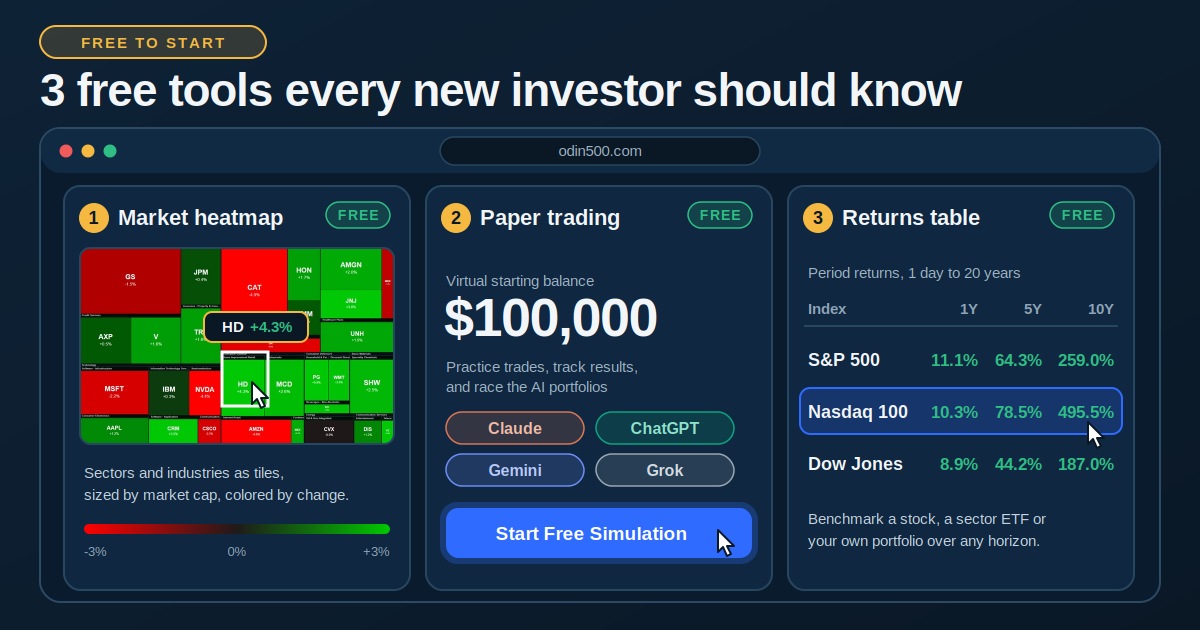
Starting out in the stock market can feel like walking into a room full of screens, all flashing different numbers. The good news is that you don't need to risk a dollar to learn your way around. Odin500's free plan includes three tools that work well together: a heatmap to see the market, a free paper trading simulator to practice, and a returns table to measure how you're doing. Here is what each one does and how a beginner can use it.
Quick answer: Use the heatmap to see what the market is doing, the paper trading simulator to practice without risking real money, and the returns table to check your results against a benchmark. You can set up all three in about ten minutes.
1. The market heatmap: see the whole market at once
A heatmap turns hundreds of stocks into one picture. On Odin500's heatmap, every stock is a tile. Tiles are grouped by sector and industry, sized by market capitalization and colored by price change over the period you've selected. The color scale runs from -3% to +3%. Green means up, red means down, and a deeper shade means a bigger move. You can switch between the Dow Jones, S&P 500, Nasdaq-100 and ETFs.
Why it helps beginners. A list of tickers tells you very little. A heatmap shows you in seconds whether the market moved together or whether one corner did all the work. If one sector is deep red while everything else is green, that's a sector story, not a market story. Our guide to sector rotation shows how those stories play out.
Try this. Spend two minutes with the S&P 500 view. Find the greenest sector and the reddest one, then look up one stock from each on its ticker page. Do it regularly and you'll start to recognize patterns. One tip: the color scale tops out at 3%, so a stock down 3% and one down 8% look the same. The table below the map lists the exact percentage for each stock. If you want a fuller walkthrough, see how to read a stock heatmap.
2. The free paper trading simulator: practice without risk
Paper trading means buying and selling with pretend money at real market prices. Odin500's free paper trading simulator gives you a virtual portfolio, so you can place trades, watch the results on performance charts and learn from your mistakes without risking real cash.
It also adds a twist most simulators don't. You can compare your results with live AI-managed portfolios run by Claude, ChatGPT, Gemini and Grok across the S&P 500, Dow Jones and Nasdaq-100. The AI portfolio leaderboard is public, and the free plan previews the first four open positions of every published portfolio and includes up to five AI portfolios of your own. Our look at which AI model is winning explains how to read the rankings. When you're ready, sign up for free and start your own.
Habits worth building. Paper trading only teaches you something if you treat it seriously:
Write down why you bought. A one-line reason makes it easy to judge the decision later.
Keep positions small. Practice sizing trades as if the money were real.
Review losers as carefully as winners. Mistakes are the whole point of a simulator.
Compare against a benchmark. If you gained 8% and the S&P 500 gained 11%, you lagged, even though you made money.
A fair warning. Simulated fills can differ from real trades, especially in fast markets, and it's much easier to stay calm when the money isn't real. Odin500's methodology page says the same. Treat the results as practice, not as a promise of what will happen with real money. For a longer walkthrough, read our guide to AI trading portfolios for beginners.
3. The returns table: measure results across time
The returns table compares the S&P 500, sector ETFs and key tickers across time horizons from one day to twenty years. It also lists the members of each index with their period returns, 20 symbols per page, and you can open it without signing in.
Here is how two major indexes compare at the latest daily close at the time of writing.
Index | 1 year | 5 years | 10 years | 20 years |
|---|---|---|---|---|
S&P 500 | about +10% | about +62% | about +255% | about +446% |
Nasdaq 100 | about +8% | about +71% | about +486% | about +1,500% |
The lesson is about time frames. Over one year, the S&P 500 is ahead. By five years the Nasdaq 100 has pulled in front, and over ten and twenty years it's far ahead, by roughly 1.9 times and 3.4 times. A short window can hide a long-term pattern, and a long window can hide a rough patch, so look at several. The table shows returns, not risk. In the most recent month alone, the Nasdaq 100 fell about 9.9% while the S&P 500 fell about 2.6%.
How to use it. Use the table to benchmark your paper portfolio. Pick an index, find the horizon that matches how long you've been trading, and see whether you're ahead or behind. To compare a single stock against a benchmark, Odin500's relative performance page puts the two side by side.
How the three tools work together
You can build a simple routine in about ten minutes:
Heatmap, two minutes. Find the leading and lagging sectors.
Returns table, two minutes. Check whether a move is short-term noise or part of a longer trend.
Paper trade. Place a small trade and write down the reason.
Monthly review. Compare your portfolio with the S&P 500 and, if you like, with the AI portfolios on the compare page.
Odin500 also offers free ticker pages with interactive OHLC charts and return summaries, such as AAPL, plus a market movers page for the biggest gainers and losers.
Key takeaways
The heatmap shows where the market is moving, and the returns table shows how long that has been true.
A free paper trading simulator lets you practice with virtual money and no real risk.
Compare your results with a benchmark, not just with zero.
Look at several time horizons before drawing conclusions.
Simulated results are practice. Real trading adds costs, slippage and emotion.
Frequently asked questions
What is a free paper trading simulator?
It's a tool that lets you buy and sell stocks with virtual money at real market prices. You learn how trades, portfolios and returns work without risking your own cash.
How does paper trading work on Odin500?
You build a virtual portfolio and place simulated trades at real market prices, using Odin daily closes for fills. You can track the results on performance charts and compare them with the AI portfolios. No broker is involved.
Is paper trading the same as real trading?
Not exactly. Prices are real, but simulated fills can differ from live trades, and there is no emotional pressure when the money is pretend. It's best for learning, not for predicting real results.
Do I need to pay to use these tools?
No. The heatmap, ticker pages with OHLC charts and the free paper trading simulator are included in Odin500's free plan, and you can open the returns table without an account. Paid plans add things like every open position in every published portfolio.
Do I need a broker to use a paper trading simulator?
No. Odin500 is an independent platform and doesn't connect to a broker. Your trades are simulated, so you can practice before you open a brokerage account.
This article is for educational purposes only and is not investment advice. Index returns come from Odin500's returns table at the latest daily close at the time of writing and change every day. All portfolios and simulations are for educational use.