AI Stock Portfolios, Market Data, Charts & Trading Signals

Track AI stock portfolios run by Claude, ChatGPT, and Gemini, and launch your own — plus U.S. market dashboards, OHLC historical data, heatmaps, and Odin trading signals.

Odin500 Blog

How to Read an OHLC Chart: 5 Beginner Mistakes to Avoid

Ashutosh pandey · October 30, 2026

Open, high, low, close. Every bar on an OHLC chart holds four prices, and most beginners look at only one of them. That's where most misreads start: you see a line moving up or down and miss what happened inside each bar. This guide shows how to read an OHLC chart by walking through five common mistakes, using a real trading session. On Wednesday, October 21, 2026, Netflix fell 5.3% after earnings.

Quick answer: An OHLC bar shows the open, high, low and close for one period. Read the whole bar, not just the close, and compare each open with the previous close. Then check your platform's color rule, the time frame and whether the prices are split-adjusted.

What is an OHLC chart?

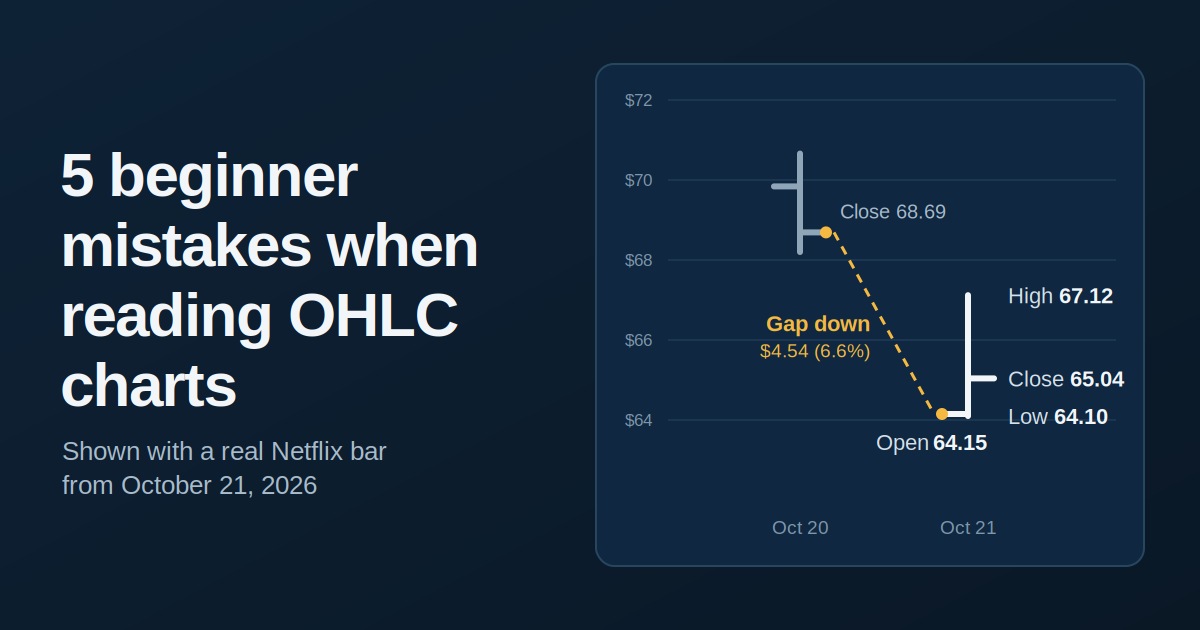
An OHLC chart draws one bar for each period, such as a day, a week or an hour. Each bar records the open, high, low and close. A vertical line runs from the low to the high, a small tick on the left marks the open, and a tick on the right marks the close. Candlestick charts show the same four numbers, with a filled body between the open and the close.

Here's the Netflix (NFLX) daily bar we'll use throughout. It's the same session we broke down in our market movers guide, so you can read the news there and the chart here.

Netflix, October 21, 2026

Price

Previous close (Oct 20)

$68.69

Open

$64.15

High

$67.12

Low

$64.10

Close

$65.04

Volume

101.4 million shares

30-day average volume

36.6 million shares

You can open the same kind of interactive OHLC chart for any U.S. stock on its Odin500 ticker page, such as AAPL. Odin500 builds its charts from daily bars. The Netflix ticker report shows its sales, profit and price history.

5 beginner mistakes when reading OHLC charts

1. Looking only at the close

Price quotes and line charts show the close, so it's easy to fixate on it. But the close is just the last price of the session. Netflix closed at $65.04, yet it traded between $64.10 and $67.12, a $3.02 range. It finished only $0.94 above the low, which puts the close in the bottom third of the day's range. Volume of 101.4 million shares was nearly three times the 30-day average, so the move was heavily traded.

How to avoid it: read the whole bar. Check where the close sits in the range and how big the range is, then compare volume with its recent average. The market movers page is a quick way to spot days like this.

2. Ignoring the gap from yesterday's close

Beginners compare a bar's open with its close and forget the previous close. Netflix reported earnings after Tuesday's close, so on Wednesday it opened at $64.15. That's $4.54, or 6.6%, below the $68.69 it closed at the day before, and pre-market quotes had already shown it down about the same amount. The gap was bigger than the whole day's loss. During the session itself, the stock actually gained $0.89, or 1.4%, from the open.

How to avoid it: look for white space between one bar's close and the next bar's open. A gap means the price jumped while the market was closed, usually on news, so no regular-session trades happened at the prices in between. When you spot one, check the pre-market volume and the catalyst, as our market movers guide suggests.

3. Trusting the color alone

Netflix fell 5.3% but closed above its open. On platforms that color bars by open versus close, that bar looks like an up day. On platforms that color by the previous close, it's red. Color conventions also vary by region. In China, Japan and South Korea, red is traditionally used for up.

How to avoid it: check your platform's color rule once. When the color and the quoted percentage change disagree, trust the numbers. Heatmaps have a similar trap, because their shades stop at a fixed point. We explain that in how to read a stock heatmap.

4. Ignoring the time frame

A daily bar isn't a weekly bar. The high on a weekly bar is the highest price of the whole week, and a five-minute bar is a sliver of one day. Zoom in and one dramatic bar can look like the whole story. Zoom out and the picture changes. Netflix's $64.10 low was a 52-week low at the time, and the $65.04 close sat about 44% below its 52-week high of $116.73.

How to avoid it: view the same stock on at least two time frames, daily for detail and weekly or monthly for context. Odin500's relative performance page lists returns from one day to 20 years next to the S&P 500, and the statistics pages show annual returns. Both give you the long view.

5. Forgetting about splits and dividends

Historical prices can be adjusted or unadjusted. Netflix announced a 10-for-1 stock split on October 30, 2025, after the shares had climbed above $1,000, and split-adjusted trading began on November 17, 2025. An unadjusted chart shows a drop of roughly 90% overnight, even though no one lost money. Adjusted data divides the older prices by ten so the history lines up. Adjusted data also accounts for dividends, which nudge older prices down slightly.

How to avoid it: check whether your data is split-adjusted before you compare prices across time. Even good data deserves a second look. Odin500's methodology page says that paper-trading fills can differ from live execution around corporate actions, and that critical data should be verified independently. Premium accounts can download historical data for their own checks.

Put it into practice

Reading bars gets easier with repetition. Pick a stock you follow, such as a Nasdaq-100 name like Netflix, and write down the open, high, low and close for a week. Then check each open against the previous close. Odin signals are generated daily from price action, so they're a useful thing to compare against what the bars show.

When you're ready to test ideas without risking money, try a virtual portfolio. Our guide on AI trading portfolios for beginners walks through how to practice safely. For a weekly recap of index moves and signal highlights, the Odin500 newsletter publishes every Sunday.

Key takeaways

  • The close is one of four prices, so read the whole bar.

  • Compare each open with the previous close to spot gaps.

  • A bar's color may not match the day's percentage change.

  • Check at least two time frames before judging a move.

  • Use split-adjusted data when comparing prices over time.

Frequently asked questions

What does OHLC stand for?

OHLC stands for open, high, low and close, the four prices recorded for every period on the chart.

How do you read an OHLC bar?

Find the vertical line first. Its top is the high and its bottom is the low. The tick on the left is the open and the tick on the right is the close. Then compare the open with the previous close to see whether the price gapped.

What is the difference between an OHLC chart and a candlestick chart?

Both show the same four prices. An OHLC chart uses a vertical line with ticks for the open and close, while a candlestick chart uses a filled body between them.

Why does my chart show a green bar on a day the stock fell?

Many platforms color by open versus close. If the stock gapped down at the open and then recovered a little, the bar can close above its open and still sit below the previous close.

What does a gap on an OHLC chart mean?

A gap is a jump between one bar's close and the next bar's open. It usually happens when news, such as earnings, arrives while the market is closed.

Should I use adjusted or unadjusted OHLC data?

Use adjusted data when comparing prices or returns over long periods, because it corrects for splits and dividends. Unadjusted data shows the prices that actually traded on each day.

Where can I see OHLC charts for free?

Odin500 ticker pages include interactive OHLC charts on the free plan. You can pair them with the heatmaps for a wider view of the market.

This article is for educational purposes only and is not investment advice. Netflix figures reflect the regular-session close on October 21, 2026, and may differ slightly between data providers.

← Back to Blog

Build an AI portfolio in minutes

Give Claude, ChatGPT, Gemini or Grok a mandate and watch it trade a $100,000 virtual book against the S&P 500, Nasdaq-100 and Dow — with every position and trade on record.

See the AI portfolios

Free to start. No card required.

Beta
Odin AI Portfolio
Markets
Indices
Tickers
Market Movers
Heatmaps
Sector DataNewsNewsletterBlog
Statistics
Relative Performance
Ticker Reports
Historical DataPricing

Odin500 Blog

How to Read an OHLC Chart: 5 Beginner Mistakes to Avoid

Ashutosh pandey · October 30, 2026

Open, high, low, close. Every bar on an OHLC chart holds four prices, and most beginners look at only one of them. That's where most misreads start: you see a line moving up or down and miss what happened inside each bar. This guide shows how to read an OHLC chart by walking through five common mistakes, using a real trading session. On Wednesday, October 21, 2026, Netflix fell 5.3% after earnings.

Quick answer: An OHLC bar shows the open, high, low and close for one period. Read the whole bar, not just the close, and compare each open with the previous close. Then check your platform's color rule, the time frame and whether the prices are split-adjusted.

What is an OHLC chart?

An OHLC chart draws one bar for each period, such as a day, a week or an hour. Each bar records the open, high, low and close. A vertical line runs from the low to the high, a small tick on the left marks the open, and a tick on the right marks the close. Candlestick charts show the same four numbers, with a filled body between the open and the close.

Here's the Netflix (NFLX) daily bar we'll use throughout. It's the same session we broke down in our market movers guide, so you can read the news there and the chart here.

Netflix, October 21, 2026

Price

Previous close (Oct 20)

$68.69

Open

$64.15

High

$67.12

Low

$64.10

Close

$65.04

Volume

101.4 million shares

30-day average volume

36.6 million shares

You can open the same kind of interactive OHLC chart for any U.S. stock on its Odin500 ticker page, such as AAPL. Odin500 builds its charts from daily bars. The Netflix ticker report shows its sales, profit and price history.

5 beginner mistakes when reading OHLC charts

1. Looking only at the close

Price quotes and line charts show the close, so it's easy to fixate on it. But the close is just the last price of the session. Netflix closed at $65.04, yet it traded between $64.10 and $67.12, a $3.02 range. It finished only $0.94 above the low, which puts the close in the bottom third of the day's range. Volume of 101.4 million shares was nearly three times the 30-day average, so the move was heavily traded.

How to avoid it: read the whole bar. Check where the close sits in the range and how big the range is, then compare volume with its recent average. The market movers page is a quick way to spot days like this.

2. Ignoring the gap from yesterday's close

Beginners compare a bar's open with its close and forget the previous close. Netflix reported earnings after Tuesday's close, so on Wednesday it opened at $64.15. That's $4.54, or 6.6%, below the $68.69 it closed at the day before, and pre-market quotes had already shown it down about the same amount. The gap was bigger than the whole day's loss. During the session itself, the stock actually gained $0.89, or 1.4%, from the open.

How to avoid it: look for white space between one bar's close and the next bar's open. A gap means the price jumped while the market was closed, usually on news, so no regular-session trades happened at the prices in between. When you spot one, check the pre-market volume and the catalyst, as our market movers guide suggests.

3. Trusting the color alone

Netflix fell 5.3% but closed above its open. On platforms that color bars by open versus close, that bar looks like an up day. On platforms that color by the previous close, it's red. Color conventions also vary by region. In China, Japan and South Korea, red is traditionally used for up.

How to avoid it: check your platform's color rule once. When the color and the quoted percentage change disagree, trust the numbers. Heatmaps have a similar trap, because their shades stop at a fixed point. We explain that in how to read a stock heatmap.

4. Ignoring the time frame

A daily bar isn't a weekly bar. The high on a weekly bar is the highest price of the whole week, and a five-minute bar is a sliver of one day. Zoom in and one dramatic bar can look like the whole story. Zoom out and the picture changes. Netflix's $64.10 low was a 52-week low at the time, and the $65.04 close sat about 44% below its 52-week high of $116.73.

How to avoid it: view the same stock on at least two time frames, daily for detail and weekly or monthly for context. Odin500's relative performance page lists returns from one day to 20 years next to the S&P 500, and the statistics pages show annual returns. Both give you the long view.

5. Forgetting about splits and dividends

Historical prices can be adjusted or unadjusted. Netflix announced a 10-for-1 stock split on October 30, 2025, after the shares had climbed above $1,000, and split-adjusted trading began on November 17, 2025. An unadjusted chart shows a drop of roughly 90% overnight, even though no one lost money. Adjusted data divides the older prices by ten so the history lines up. Adjusted data also accounts for dividends, which nudge older prices down slightly.

How to avoid it: check whether your data is split-adjusted before you compare prices across time. Even good data deserves a second look. Odin500's methodology page says that paper-trading fills can differ from live execution around corporate actions, and that critical data should be verified independently. Premium accounts can download historical data for their own checks.

Put it into practice

Reading bars gets easier with repetition. Pick a stock you follow, such as a Nasdaq-100 name like Netflix, and write down the open, high, low and close for a week. Then check each open against the previous close. Odin signals are generated daily from price action, so they're a useful thing to compare against what the bars show.

When you're ready to test ideas without risking money, try a virtual portfolio. Our guide on AI trading portfolios for beginners walks through how to practice safely. For a weekly recap of index moves and signal highlights, the Odin500 newsletter publishes every Sunday.

Key takeaways

  • The close is one of four prices, so read the whole bar.

  • Compare each open with the previous close to spot gaps.

  • A bar's color may not match the day's percentage change.

  • Check at least two time frames before judging a move.

  • Use split-adjusted data when comparing prices over time.

Frequently asked questions

What does OHLC stand for?

OHLC stands for open, high, low and close, the four prices recorded for every period on the chart.

How do you read an OHLC bar?

Find the vertical line first. Its top is the high and its bottom is the low. The tick on the left is the open and the tick on the right is the close. Then compare the open with the previous close to see whether the price gapped.

What is the difference between an OHLC chart and a candlestick chart?

Both show the same four prices. An OHLC chart uses a vertical line with ticks for the open and close, while a candlestick chart uses a filled body between them.

Why does my chart show a green bar on a day the stock fell?

Many platforms color by open versus close. If the stock gapped down at the open and then recovered a little, the bar can close above its open and still sit below the previous close.

What does a gap on an OHLC chart mean?

A gap is a jump between one bar's close and the next bar's open. It usually happens when news, such as earnings, arrives while the market is closed.

Should I use adjusted or unadjusted OHLC data?

Use adjusted data when comparing prices or returns over long periods, because it corrects for splits and dividends. Unadjusted data shows the prices that actually traded on each day.

Where can I see OHLC charts for free?

Odin500 ticker pages include interactive OHLC charts on the free plan. You can pair them with the heatmaps for a wider view of the market.

This article is for educational purposes only and is not investment advice. Netflix figures reflect the regular-session close on October 21, 2026, and may differ slightly between data providers.

← Back to Blog

Build an AI portfolio in minutes

Give Claude, ChatGPT, Gemini or Grok a mandate and watch it trade a $100,000 virtual book against the S&P 500, Nasdaq-100 and Dow — with every position and trade on record.

See the AI portfolios

Free to start. No card required.

Recommended reading

  • How to Paper Trade Before Risking Real Money
  • Upcoming Stock Splits: Sandisk, SOXX, Seneca and More
  • How to Build a Stock Watchlist That Actually Works
  • Which AI Is Best at Picking Stocks? Claude vs ChatGPT vs Gemini