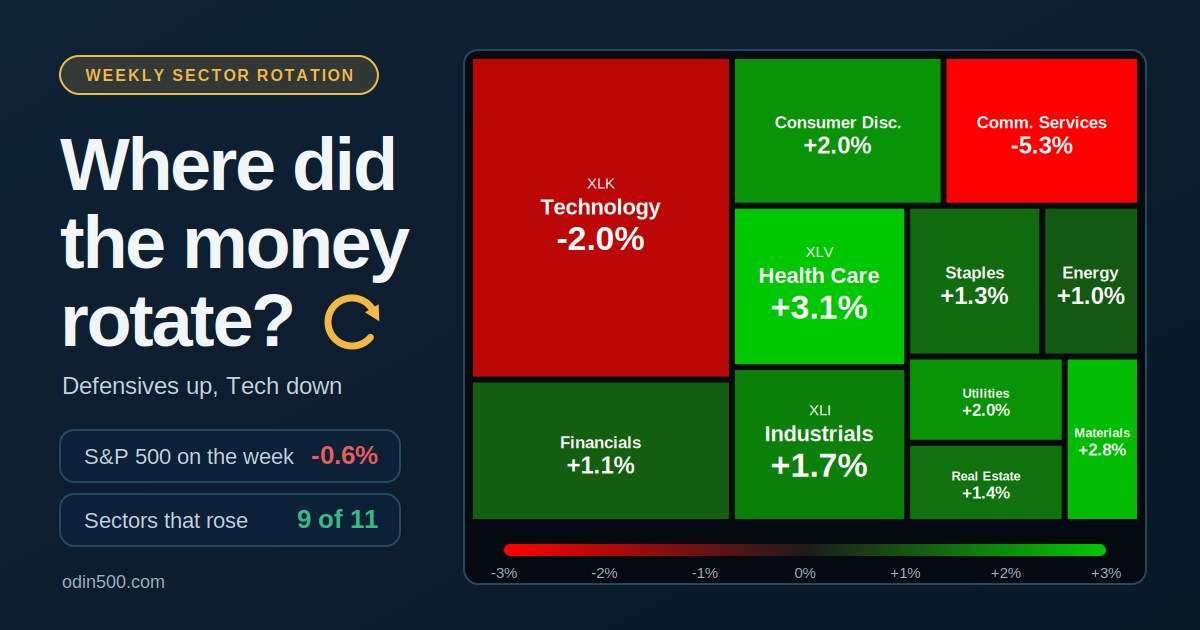
The S&P 500 slipped over the week of October 26 to 30, but that headline hides the real story. Nine of the eleven sectors rose, and money moved out of technology and communication services into health care, materials and utilities. Here is the weekly sector performance ranking, what drove it, and how to see it for yourself on a heatmap.
Quick answer: Health Care led with +3.12% and Communication Services lagged at -5.32%, a gap of 8.44 percentage points, while the S&P 500 lost 0.57%.
The weekly sector scoreboard
Rank | Sector | ETF | Weekly change |
|---|---|---|---|
1 | Health Care | +3.12% | |
2 | Materials | +2.79% | |
3 | Utilities | +2.04% | |
4 | Consumer Discretionary | +2.02% | |
5 | Industrials | +1.69% | |
6 | Real Estate | +1.41% | |
7 | Consumer Staples | +1.31% | |
8 | Financials | +1.09% | |
9 | Energy | +1.00% | |
10 | Technology | -2.03% | |
11 | Communication Services | -5.32% |
Sector moves use the Select Sector SPDR ETFs as proxies. The gap between the best and worst sector was 8.44 percentage points. Other providers that track the S&P sector indexes show slightly different figures. One, for example, has Consumer Staples at +1.6%.
This kind of rotation is easier to read once you know the cycle. Our guide to sector rotation explains how leadership changes over time.
What drove the rotation
The leaders. Health Care led after Eli Lilly raised its 2026 revenue forecast to $91 billion to $92 billion on strong demand for its weight-loss drugs. The stock gained about 11% on the week. Consumer Discretionary rose 2.02% even though Amazon fell, because Tesla, GM and Chipotle carried it. Utilities climbed too, a typical pattern when investors favor steadier, cash-generating businesses.
The laggards. Technology and Communication Services carry most of the AI spending story, and that story got a reality check. Large companies reported heavy AI investment without the cash flow investors wanted. Alphabet fell 12.6% on Thursday, its worst day as a public company, after reporting negative free cash flow of $9.07 billion. Meta slid on its AI spending plans, and Reddit sank on traffic worries tied to Google's AI search. Then Intel fell 28.6% on Friday after guiding its fourth-quarter revenue to $15 billion to $16 billion. Technology dropped nearly 5% that day alone. For more on what moves this sector, see our look at technology sector performance.
Energy was jumpy. Energy gained only 1.0% on the week, but the path was rough. It was the worst sector on Tuesday as oil fell on hopes for peace talks, and the best sector on Friday.
The index hid the breadth
The cap-weighted S&P 500 lost 0.57% and the Nasdaq Composite lost 2.0%, but the average stock did much better. The equal-weight S&P 500 gained about 0.8%, and the small-cap Russell 2000 rose 1.3%. That gap shows how much a few giant technology and communication names drive the headline index.
It's a pattern, too. The equal-weight index has now beaten the regular S&P 500 for four weeks in a row. Year to date it's ahead by 3.64 percentage points, 15.33% against 11.69%, the widest gap since late August. Rotation can look like a selloff on top and a rally underneath. You can find the equal-weight fund, RSP, next to SPY on the Odin500 market dashboard.
How to see rotation on a sector heatmap
A heatmap makes rotation easy to spot because tiles are grouped by sector and colored by price change. On Odin500's heatmap, the color scale runs from -3% to +3%. Here is how to read a rotation week:
Pick the index. Start with the S&P 500 heatmap to see all eleven sectors.
Scan for blocks of one color. A mostly green map with one red patch means a sector story. In this case, Technology and Communication Services would stand out in red against a green background.
Check the biggest tiles. Mega-cap stocks take up the most space, so a few large red tiles can drag the headline index even when most of the map is green.
Respect the cap. The scale tops out at 3%, so a -3% sector and a -5% sector look the same. Check the exact figure in the table under the map.
Zoom out to the week. The heatmap shows the day's moves. For a longer view, use the 5-day and 1-month columns on the market dashboard and the sector pages.
New to heatmaps? Start with our guide on how to read a stock heatmap. For a closer look at one group, the sector data pages cover each sector, and the market movers page shows which individual stocks sit behind the biggest moves. Our market movers guide walks through how to use it.
The bigger picture: year to date
One week is a snapshot. Through October 30, Energy was up 59.71% on the year, Technology 25.14% and Health Care 20.91%. Materials and Consumer Staples also beat the S&P 500's 11.69%. Communication Services was last at -14.36%, down from -9.56% a week earlier.
What to watch next
Rotation only matters if it lasts. Watch whether Technology stabilizes against the broad market, whether Health Care keeps its lead, and whether breadth holds up. A rotation that fades after one week was mostly noise. For a weekly recap in your inbox, there's the Odin500 newsletter.
Key takeaways
Nine of eleven sectors rose even though the S&P 500 fell.
Health Care, Materials and Utilities led, while Technology and Communication Services lagged.
The equal-weight S&P 500 and the Russell 2000 gained, so the average stock did better than the index.
A heatmap shows rotation at a glance, but check exact numbers because the color scale is capped.
Frequently asked questions
What is sector rotation?
Sector rotation is the movement of investor money from one market sector to another as economic conditions, interest rates and earnings expectations change. Leaders and laggards swap places over time.
Why did the S&P 500 fall if nine of eleven sectors rose?
The index is weighted by market value, and the two sectors that fell, Technology and Communication Services, hold the biggest stocks. A few large declines can outweigh many small gains.
Why do defensive sectors lead when technology sells off?
Investors often move toward health care, utilities and consumer staples when growth stocks look expensive or uncertain, because their earnings tend to be steadier.
Where can I see weekly sector performance?
The Odin500 heatmap shows how sectors and stocks are moving each day. For a weekly view, compare the 5-day returns on the market dashboard and the sector data pages.
This article is for educational purposes only and is not investment advice. Weekly figures are Select Sector SPDR ETF returns for October 26 to 30, 2026, as reported by The Glass Desk, and may differ slightly between data providers.